 Examining the NVAR Real Estate Market
THERE WILL LIKELY BE AN ASTERISK next to 2020 real estate market data indicating that for several months in the year of the COVID-19 pandemic, nothing was business as usual.
NVAR REGION HOME SALES
The number of housing units sold in the NVAR region has remained surprisingly stable in recent years – typically bottoming out at about 1,000 units per month in winter and rising to a peak of about 2,500 units in the spring and early summer. The arrival of COVID-19 and subsequent state mandates to protect public health dramatically disrupted this cyclical pattern. (Figure 1.)
Figure 1. Closed Sales in the NVAR Region
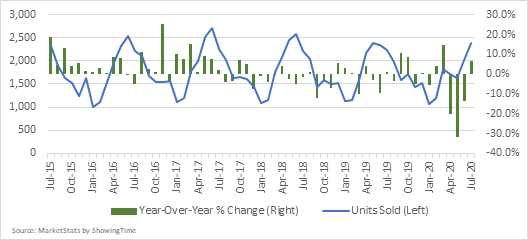
The number of closed sales in the NVAR region declined 20.1% from April 2019 to April 2020, which was the largest year-over-year decline in closed sales in over five years up to that point. The trend continued in May with closed sales falling by almost one-third compared to May 2019.
As business and movement restrictions eased in May and June, homebuyers hit the market with pent-up enthusiasm.
June 2020 sales were still down by 13.7% year-over-year, but July saw a surge in the number of closed sales – exceeding July 2019 sales by about 6.4% across the NVAR region.
INVENTORY
The surprising stability in the number of closed sales has been in spite of a persistent downward trend in inventory. Even before the pandemic disrupted normal spring inventory gains, the number of active listings had declined markedly over the past five years. (Figure 2.)
Figure 2. Active Listings in the NVAR Region
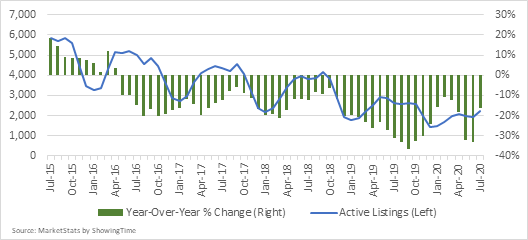
The most recent market peak was in July of 2015 when there were 5,864 active listings in the region. From this peak, the number of active listings declined to a low of 1,446 in December 2019. Although there was evidence at the outset of 2020 that perhaps the number of listings was stabilizing, that ended with a near record decline in year-over-year active listings in late March and early April.
The number of active listings dropped 32% from May 2019 to May 2020 and 33% from June 2019 to June 2020. While the number of active listings went up from June to July, it remained 16.1% below July 2019. For perspective, in July 2020 there were more than 3,600 fewer homes for sale in the NVAR region compared to July 2015. Low inventory continues to be a challenge for buyers on their search for housing options.
HOME PRICES
The stable number of closed sales in concert with the continued decline in active listings has resulted in price escalation (supply and demand curves in action). From July 2015 to July 2020, the median price of sold homes in the NVAR region increased 25% from $499,900 to $625,000. (Figure 3.)
Figure 3. Median Sales Price of Sold Homes in the NVAR Region
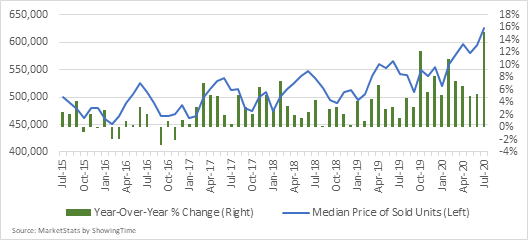
Furthermore, year-over-year increases have grown larger recently. The average year-over-year increase in the median price of sold homes from July 2015 through December 2018 was 2.1%. The average year-over-year increase in the median price of sold homes from January 2019 through July 2020 was 5.9%.
In July 2020, the median price of sold homes increased 15.2% from July 2019, the largest year-over-year increase in the median price of homes sold in the past five years. The recent price increases have been supported by affordable mortgage rates that are almost 100 basis points lower than last year. The data reflect the median prices of homes that were actually sold, which is not the same as saying all home values increased by 15% year-over-year in July. It is possible that some of this gain can be explained because of market selectivity. Homebuyers in July may represent those with relatively more stable jobs and more household wealth. Therefore, the action may have been biased towards more expensive homes.
HOME TYPE
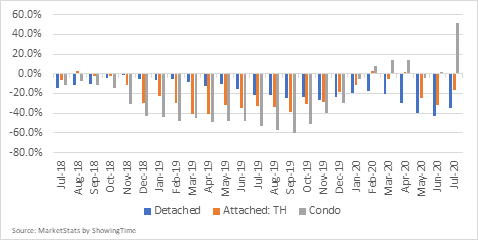
The drop in the number of closed sales in the NVAR region occurred across all home types for the entire second quarter of 2020 (April, May and June) with the largest decline in May. Detached home sales declined 30.1% from May 2019 to May 2020, closed sales of townhomes declined 30.9%, and closed sales of condos declined 35.9%. (Figure 4.)
Figure 4. Closed Sales by Home Type in the NVAR Region (Y-o-Y% Change)
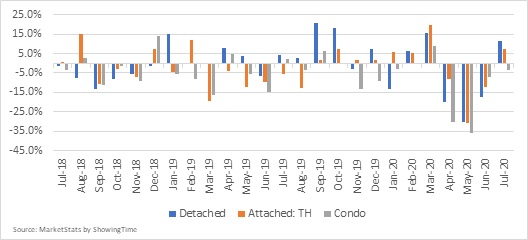
Since May, however, closed sales have begun to rebound. The number of closed sales of detached homes (+11.6%) and townhomes (+7.5%) both increased from July 2019 to July 2020, though condo sales underperformed in July 2020 compared to July 2019 (-3.4%).
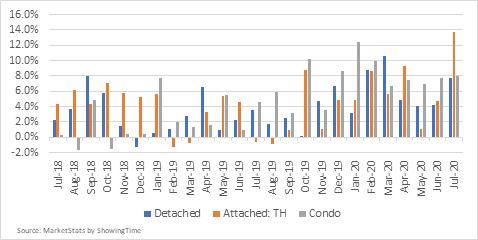
While overall housing inventory has contracted regionally, changes in active inventory has varied notably by home type. The number of active listings of detached homes declined year-over-year for the first seven months of 2020, decreasing 42.7% from June 2019 to June 2020. (Figure 5.) In contrast, the number of active listings of condos increased year- over-year for five of the first seven months, with the most notable change occurring in July 2020. The number of active listings of condos increased 51.8% from 467 units in July 2019 to 709 units in July 2020. It is too soon to determine if this increase was the result of units that had been scheduled to go on market in May and June, or if the increase was the result of COVID-19 changing living preferences.
Figure 5. Active Listings by Home Type in the NVAR Region (Y-o-Y% Change)
While the median price of sold homes of all types has increased, it is striking that the year-over-year increases in the median price of condos remained above 7% during and after the stay-at-home mandate brought by the pandemic. (Figure 6.) The median price of sold condos increased 7.5% year-over-year in April, 7% in May, 7.7% in June, and 7.9% in July.
Figure 6. Year-Over-Year Change in Median Prices by Home Type in the NVAR Region
Increases in the median price of sold detached homes were also steady but underperformed condos. The median price of sold detached homes increased 4.8% year-over-year in April, 4.1% in May, 4.2% in June, and 7.7% in July.
In contrast, price increases of sold townhomes have been more volatile. The median price of sold townhomes increased 9.3% year-over-year in April, 1% in May, 4.8% in June, and 13.7% in July. Although it is surprising that the median price increases of sold condos remained stable during the pandemic, low total supply means that committed buyers have limited options.
SUB-REGION
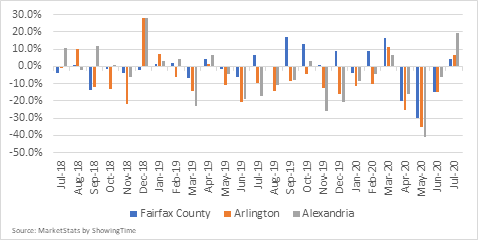
The number of closed sales in Fairfax County, Arlington and Alexandria – the largest sub-regions in the NVAR market – declined sharply in March and April before a more modest decline in June and an increase in July. Closed sales in Fairfax County declined 20.4% year- over-year in March, 30.1% in April, and 14.8% in June before recording a year-over-year increase in the number of closed sales of 4.5% in July. Arlington recorded a nearly identical trend as Fairfax County, with closed sales declining 25.4% year-over-year in March, 34.9% in April, and 14.6% in June before recording a year-over-year increase in the number of closed sales of 6.4% in July. Closed sales in Alexandria recorded a similar, but more pronounced trend. Closed sales in Alexandria declined 40.8% year-over-year in May before increasing 19.2% year-over-year in July. (Figure 7.)
Figure 7. Year-Over-Year Change in Closed Sales by NVAR Sub-Region
Unlike closed sales, active listings in the sub-regions have not followed similar trends. While the number of active listings in Fairfax County declined throughout 2020, Alexandria and Arlington have recorded year- over-year increases. The number of active listings in Alexandria increased year-over-year for four of the first seven months of 2020 (Figure 8.).
Figure 8. Year-Over-Year Change in Active Listings by NVAR Sub-Region
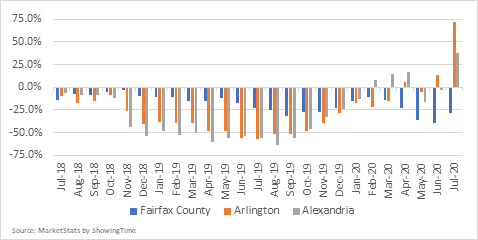
Most recently, the number of active listings in Alexandria increased 38.3% from July 2019 to July 2020. The number of active listings in Arlington increased year-over-year in April, June and July. The number of active listings in Arlington increased a striking 72.1% from 215 active listings in July 2019 to 370 active listings in July 2020. The reason is unclear: could the bubble of anticipation created by Amazon HQ2 finally have burst? Did those waiting to sell need to get out of the market, or did price increases become too enticing for homeowners to ignore?
Figure 9. Year-Over-Year Change in Median Prices by NVAR Sub-Region
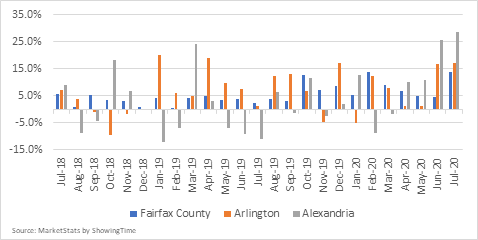
Median price increases in Alexandria have outperformed both Fairfax and Arlington since March. In Alexandria, the average year-over-year increase in the median sales price of sold homes from April through July was 18.7%. The average median price of sold homes in Alexandria increased 25.7% from June 2019 to June 2020 and 28.6% from July 2019 to July 2020. In Fairfax County and Arlington, the average year-over-year increase in the median sales price of sold homes from April through July were 7.5% and 9.1%, respectively. (Figure 9.)
CONCLUSION
Even with household concerns about job and income security, demand for residential property continues to outstrip supply in the NVAR area. After years of seeing the number of sales stay mostly stable while inventories continued to drop, the market appears to remain robust. Underlying strengths of the regional economy paired with low inventory forces buyers to buy what they can, even if it is not necessarily what they want.
Although closed sales have rebounded, it is unlikely that we will make up lost ground from spring and early summer before fall. In a survey sent to NVAR top producers, many believed the market surge of mid-summer will last into early fall. The GMU Center for Regional Analysis expects that mortgage interest “FOMO” (Fear of Missing Out) will drive some increase in market activity, but lingering economic and income uncertainty may counterbalance that enthusiasm. The decision by most area school districts to cancel in-person teaching may dampen overall market activity in September and October – and the remaining pent-up demand on both sides of the market may not materialize until Spring 2021.
Depending on how the pandemic affects the remaining months of 2020, the next year could hold a substantial boom for the real estate market in Northern Virginia.
Dr. Terry Clower is the director of the George Mason University Center for Regional Analysis.
Dr. Keith Waters is a research associate for the George Mason University Center for Regional Analysis.