
What Can We Learn From Previous Economic Downturns?
THE MONTHS FOLLOWING THE OUTBREAK of the COVID-19 pandemic have been among the most turbulent in memory. The most recent data tell us that more than 88,000 individuals in Northern Virginia are unemployed. However, the brunt of the economic impact is being felt by hospitality, retail and gig workers (think Uber drivers).
"While, so far, the Washington, D.C. region seems to have been spared the housing market volatility seen in New York and San Francisco, there have been some long developing trends regarding domestic out-migration that may be exacerbated by the current crisis."
At first glance, it may appear that the concentration of job loss in comparatively lower wage sectors of the economy means that rental housing would see the greatest market disruption. This has been borne out by the number of renters who are behind on rent with the potential for more trouble ahead as moratoriums on evictions expire. However, there are also indications that some homeowners, particularly those who rely on second jobs in hospitality, retail, and gig work, will not be able to afford an owner-occupied home in Northern Virginia, particularly if mortgage deferral programs require bubble payments.
The other housing market shift that may be underway is a scramble for households looking for larger homes to accommodate working from home and home schooling, or simply escaping to lower density environments. While, so far, the Washington, D.C. region seems to have been spared the housing market volatility seen in New York and San Francisco, there have been some long developing trends regarding domestic out-migration that may be exacerbated by the current crisis.
Will the threat of COVID-19 alter housing preferences, such as relatively less importance placed on proximity to Metro versus total residence square footage? Will second- home owners sell their close-in condo and live full time at the beach? Of course, we do not know how the pandemic will impact long-term housing demand. What we can do is to look back on how previous economic recessions have impacted domestic migration in this region to gain at least some sense of what we might expect in the next year or two as the economy recovers from pandemic- related business disruptions.
This article examines net domestic migration in the region and for the NVAR service area, which is the difference between the number of people moving to this region from elsewhere in the U.S. versus those leaving the region. For clarity, this analysis does not include natural population change (births and deaths), nor does it include international migration. Also, during the years examined, the technical definition of the counties included in the D.C. Metropolitan Statistical Area changed with the addition of Culpeper County, Va.; Madison County, Va.; and Rappahannock County, Va. – though the relative population of these additions does not meaningfully affect overall regional migration patterns.
WASHINGTON, D.C. METRO
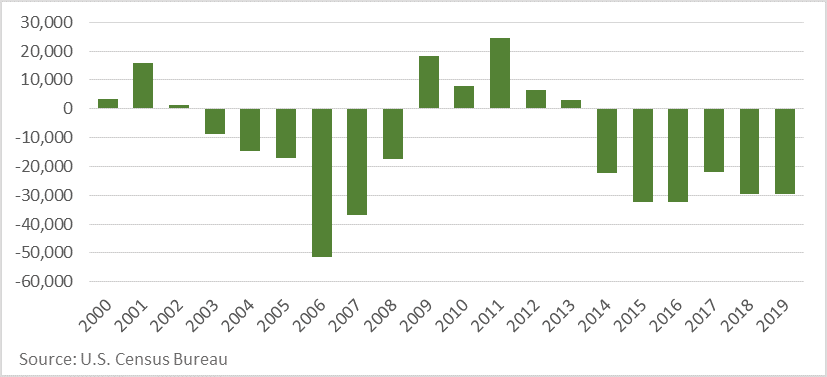
The D.C. metro area has only recorded net domestic in-migration during two periods over the past 20 years: in the early 2000s and following the 2008 financial crisis (Figure 1). The first period of net domestic in- migration in the D.C. metro was from 2000 to 2002. During these three years, the D.C. metro added 20,825 domestic migrants. The second period of net in-migration was from 2009 to 2013 when the region gained 60,000 domestic migrants. The gains in domestic migrants during these two periods, however, were offset by losses in the alternate years. Overall, the area lost 233,613 domestic migrants from 2000 to 2019. It would appear that people flock to this region for the economic shelter of the federal government, through jobs in federal agencies or employment at federal contractors, when the nation is in recession and leave when there are plentiful jobs elsewhere.
Figure 1. Domestic Migration - D.C. Metro
NVAR
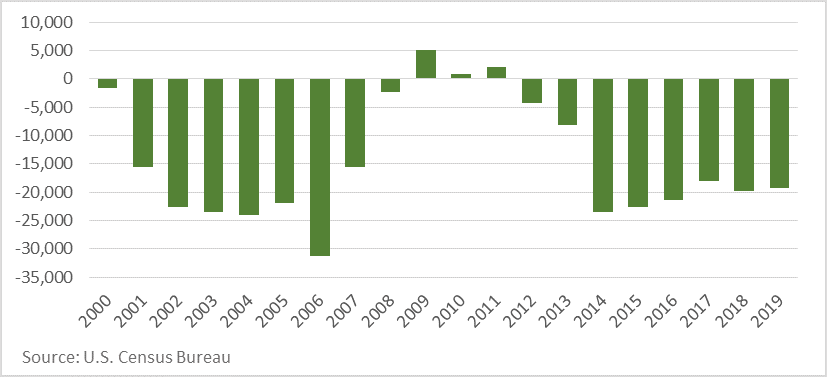
In contrast with the D.C. metro as a whole, the NVAR region only recorded one period of net domestic in-migration (Figure 2). The NVAR region recorded net domestic in-migration for three years from 2009 to 2011. During this period, the NVAR region gained a total of 8,105 domestic migrants. Despite the gains of domestic in-migration following the financial crisis, the NVAR region recorded net out-migration of 287,177 domestic residents from 2000 to 2019.
Figure 2. Domestic Migration - NVAR
NVAR SUB-REGIONS
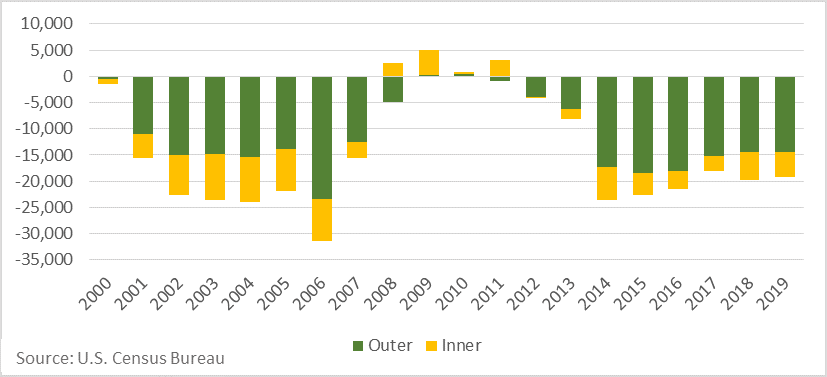
Breaking the NVAR region into two sub-regions reveals that net domestic in-migration to the NVAR region was primarily comprised of domestic in-migration to areas closer to D.C. (Figure 3). The close-in areas of the NVAR region, defined as Arlington and Alexandria, recorded net domestic in-migration from 2008 to 2011. Over this period, close-in markets gained a total of 10,881 domestic migrants. The outer sub-region, defined as Fairfax County, Fairfax City and Falls Church, only recorded net domestic in-migration in 2009 and 2010 totaling 763 net new domestic residents.
Figure 3. NVAR Domestic Migration - Inner vs. Outer
BEYOND NVAR
For comparison purposes, counties just outside the NVAR region in Virginia (Loudoun County and Prince William County) recorded net domestic in- migration every single year from 2000 to 2019 (Figure 4). Over the entire period, Loudoun and Prince William together gained a total of 181,788 domestic migrants. The pace of gains for these markets has slowed as they have “matured” over recent years. From 2000 to 2009, Loudoun and Prince William together gained an average of 13,105 domestic residents per year. From 2010 to 2019, Loudoun and Prince William together gained an average of just 5,074 domestic residents per year.
Figure 4. Domestic Migration - Beyond NVAR
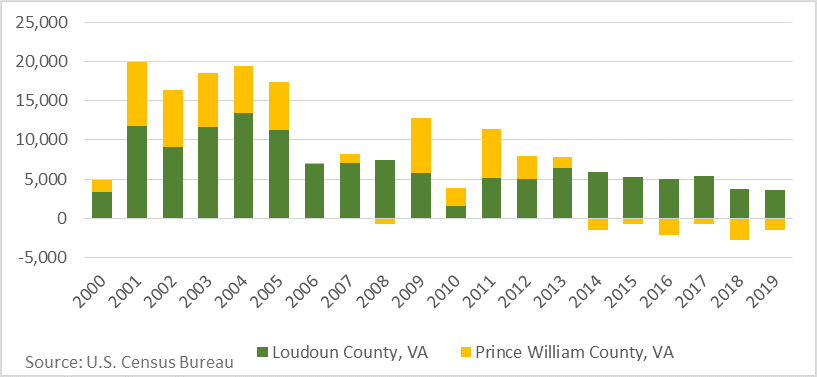
As a reminder, Figure 4 is not indicating that Prince William is losing population, but that more of its growth is based in natural population change and international migration.
MEDIAN PRICES AND PRICE PER SQUARE FOOT
One plausible reason for net domestic out-migration of the NVAR region is the high price of housing in the NVAR region (Figure 5). The monthly median prices of sold homes were approximately 10% lower in Loudoun County than in the NVAR region from 2010 to 2020 (Figure 5). Accounting for the size of the house, the monthly median prices per square foot of sold homes were approximately 30% lower in Loudoun County than in the NVAR region over the same period (Figure 6). The larger difference in median prices per square foot than median prices implies that sold homes in Loudoun County are larger than those sold in the NVAR region.
Figure 5. Median Price of Sold Homes
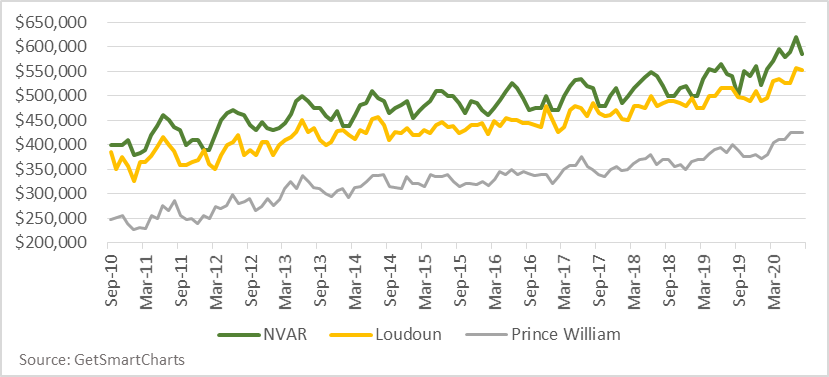
Figure 6. Median Price Per Square Foot of Sold Homes
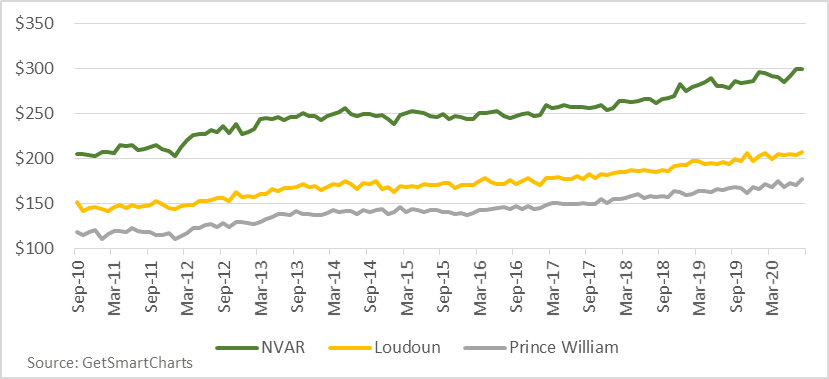
Bright MLS data confirms that the homes sold in Loudoun County in 2020 have been larger (2,913 square feet of living area) than those sold in the NVAR region (2,123 square feet of living area).
Given that the homes sold in Loudoun County are larger, and undoubtedly newer, it is easy to conclude that domestic migrants prefer larger homes, even if they are a little farther from work. As residents continue to work from home and their children attend school from home, preferences for larger homes are likely to grow even stronger.
CONCLUSION
While the D.C. metro recorded two periods of domestic in-migration from 2000 to 2019, the NVAR region recorded only one, shorter period.
Domestic in-migration to the NVAR region lasted from 2009 to 2011 and was almost exclusively the result of domestic in-migration to Arlington and Alexandria. By contrast, there was steady net domestic in-migration into the counties just beyond the NVAR region, particularly Loudoun County, over the same period.
While the median prices of homes sold in Loudoun County over the past decade were slightly lower than those sold in the NVAR region, they have substantially more living area and thus the price per square foot is much lower. In addition to being larger, homes sold in Loudoun were undoubtedly newer as well. Given this, it seems reasonable to conclude that net domestic in-migration into Loudoun County was at least partially the result of domestic preferences for larger and newer homes. If working from home becomes engrained in the work culture, even if businesses start implementing hybrid systems with work from home encouraged a few days a week, larger houses are likely to continue to be attractive to domestic workers. Such preferences may represent a headwind for selling smaller homes in the NVAR region, even if proximity to D.C. remains a benefit.
The other potential market drivers mentioned at the opening of this article, working from home and fear of density, could shift the current pattern of migration, with particular impacts on Arlington and Alexandria housing markets.
The economic development offices for Northern Virginia jurisdictions created the Economic Development Alliance in 2019, in part, to collaborate on regional talent attraction initiatives (Read more on page 37). Collectively, local jurisdictions want to bring these new workers in to strengthen Northern Virginia’s competitive advantages, particularly in information technology industries. Where these new residents will choose to live could have great significance for the work of Northern Virginia Realtors®.
Dr. Terry Clower is the director of the George Mason University Center for Regional Analysis.
Dr. Keith Waters is a research associate for the George Mason University Center for Regional Analysis.