Sales Data Takes a Minor Detour on Road to Recovery
The results are in for the Northern Virginia housing market’s first half of 2014, and the news is sobering. Inventory is up, the sales pace has slowed, prices are flat, and days on market figures are increasing.
Media reports have been quick to suggest that the regional housing market is struggling. Has the Northern Virginia market hit the proverbial wall, or is 2014 just a bump in the road?
2014: A SLOW START TO THE YEAR, NOT A TRUE SLUMP
During the first few months of 2014, the Washington area housing market performed poorly. The sluggish figures for the winter months were blamed on the extremely harsh weather the region endured in 2014. April and May figures were easy to shrug off, as June was seen as the key month for the market. Each year, the month of June typically represents the height of the residential real estate market in the Washington area, with prices and closed sales usually peaking for the year.
The June 2014 data show that the region’s housing market is having a tough time this year. By all five top-line metrics, the metro area’s housing market was down in June 2014 from its June 2013 levels. The metro area market covers all 22 jurisdictions in the Washington Metropolitan Statistical area, including the District of Columbia, five counties in Maryland, 15 counties and cities in Virginia, and Jefferson County, West Virginia.
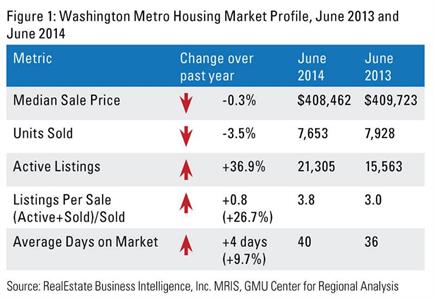
The median sale price declined by 0.3 percent, representing the region’s first June-to-June decline since 2009, when the region was in the midst of the recession. The number of active listings in June 2014 was up 37 percent from June 2013, while the number of closed sales declined by 3.5 percent. As a result, the ratio of active listings to sales increased 27 percent. The average days on the market (DOM) figure is on the rise as well: it was up 10 percent from June 2013 to June 2014.
“A clearer indicator of the relative strength of the regional housing market is the relationship between the active inventory of properties on the market and the number of units sold."
Market conditions have been slightly better in Northern Virginia in 2014, but far from great. From January 1 through June 30, 2014, there were 9,268 closed sales in the NVAR region (Arlington County, Fairfax County, cities of Alexandria, Fairfax, and Falls Church). While this represents a 10.6 percent decline from the sales pace in the first half of 2013, it is about equal to the number of closed sales in 2012.
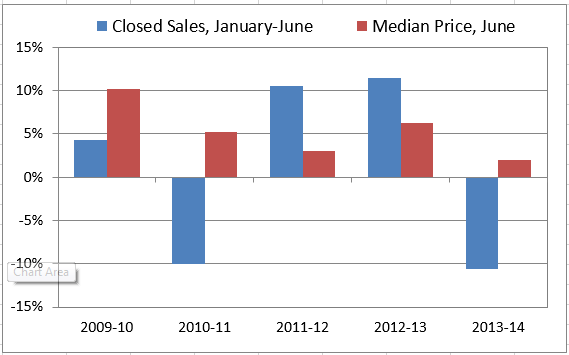 The NVAR region’s median sale price for all sales in June 2014 was $510,200, which was only up 2 percent from the June 2013 median of $500,000, making it the smallest year-over-year increase in the past five years. Still, the NVAR median price remains $100,000 higher than the metro area median.
The first half of 2014 has also brought concerns in regard to increasing DOM figures and a growing inventory. The DOM figure in the NVAR region declined sharply from 71 days in June 2009 to just 24 in June 2013. While this figure increased 24 percent to 29 days in June 2014, the current average DOM figure is still well below historical averages.
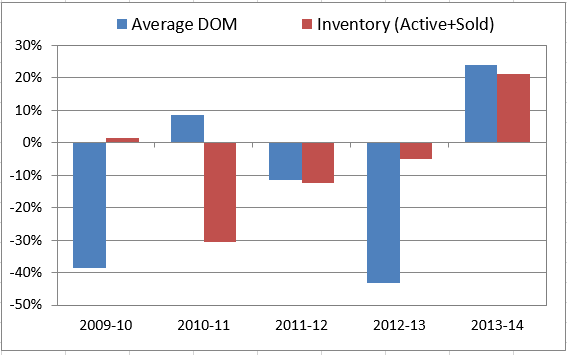 The same pattern holds true for the active inventory. In June 2010, the active inventory in the NVAR region was more than 9,900: this dipped to just 5,700 in June 2013 before increasing to about 7,000 in June 2014. Although this represents a one-year increase of 21 percent, the active inventory in June 2014 was about equal to the 2011 level and about 30 percent below the 2010 level.
A clearer indicator of the relative strength of the regional housing market is the relationship between the active inventory of properties on the market and the number of units sold. In June 2009, the ratio of active listings in the NVAR region (including units sold that month) to closed sales was 4.5. This figure increased until June 2010 before beginning a rapid descent.
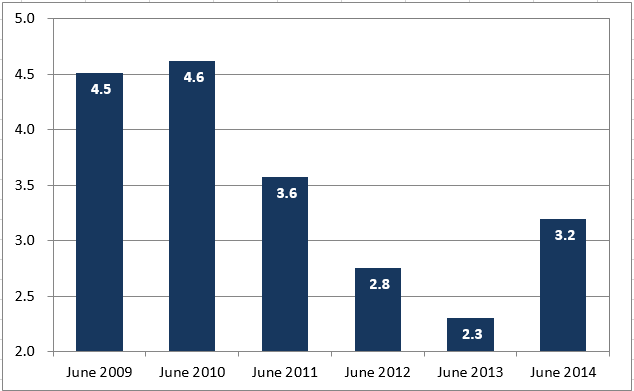 By June 2013, the active to sold ratio was 2.3, an historically low level. In June 2014 the ratio was 3.2, a 28 percent increase from 2013. Based on one year’s performance, this looks like a red flag. However, in the longer view, a ratio of 3.2 is still an indicator of a healthy market.
Another factor to consider is the makeup of the units that are sold. In 2010, just 43 percent of the units sold in the NVAR region between January and June were single-family detached units. By 2012, 48 percent of sales were of single-family detached units, which tend to sell at far higher prices than townhouses or condo units.
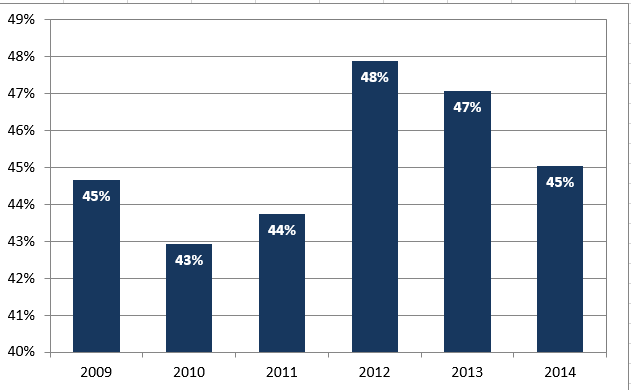
In 2013, single-family detached units represented 47 percent of all January to June sales; this figure decreased to 45 percent in 2014. As such, the slower price increase from 2013 to 2014 can probably be at least partially explained by the shift from single family to other types of housing.
THE OUTLOOK REMAINS POSITIVE
It is clear that the Washington and Northern Virginia regional housing market is not doing as well in 2014 as it had in 2013. This is no surprise, as housing is primarily a function of job growth, and the regional economy has struggled so far in 2014.
“It is clear that the Washington and Northern Virginia regional housing market is not doing as well in 2014 as it had in 2013. This is no surprise, as housing is primarily a function of job growth.”
In fact, the U.S. Bureau of Labor Statistics reports that over the 12-month period between May 2013 and May 2014, the Washington metro area added just 6,000 jobs, ranking it behind all other major metropolitan areas except for Detroit in terms of job growth. By comparison, the region added 38,000 jobs between May 2012 and May 2013 and 44,000 from May 2011 to May 2012.
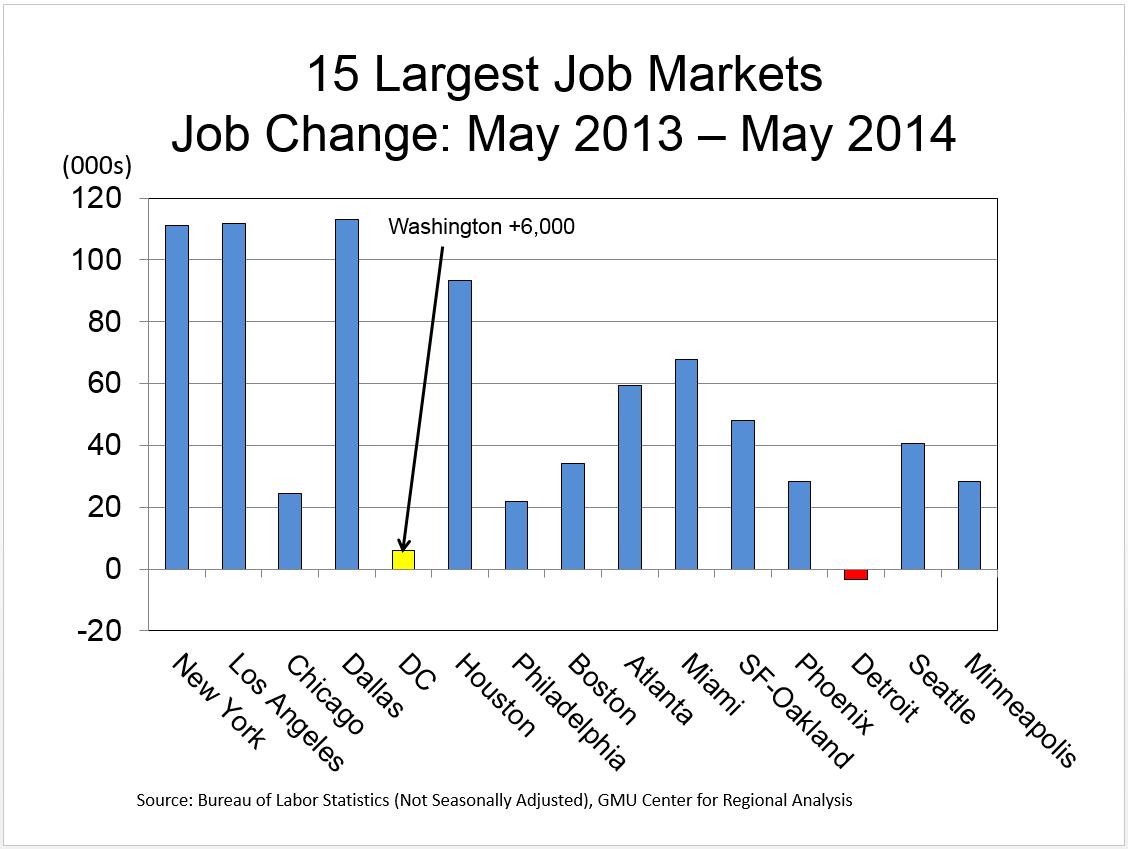
In light of the weak employment growth, it is surprising that the regional housing market isn’t doing worse. More importantly, in spite of the recent economic struggles, the area’s housing market is still far stronger than it was three or four years ago.
Looking ahead, the GMU Center for Regional Analysis expects the Washington area job market to begin improving by the end of 2014, and for the region to add at least 50,000 jobs per year for each of the next four years. The top growing job sector will likely be Professional and Business Services, but other sectors will also contribute. If the region achieves this level of job growth, the 2014 housing market will be remembered as a speed bump, not a roadblock on the path to continued economic recovery.
Momentum should build as consumer confidence edges up and people find employment that offers stability. A second wind for this year in the regional housing market would be a welcomed event.
David Versel is a Senior Research Associate at the George Mason University Center for Regional Analysis