Recent News


National Market Statistics Comparison: May 2026
The Northern Virginia housing market outperformed national trends across several key indicators in May 2026, reflecting stronger buyer demand, firmer…
June 17, 2026

Market Statistics: May 2026
The Northern Virginia housing market continued its strong spring momentum in May 2026, with double-digit increases in both closed sales…
June 11, 2026

National Market Statistics Comparison: April 2026
The Northern Virginia housing market continued to outperform national trends in April 2026, posting stronger sales growth, higher price appreciation,…
May 19, 2026

Market Statistics: April 2026
The Northern Virginia housing market delivered another month of steady growth in April 2026, with rising sales activity, increasing home values…
May 12, 2026

National Market Statistics Comparison: March 2026
The Northern Virginia housing market continued to demonstrate resilience in March 2026, posting strong gains in sales activity even as…
April 24, 2026

Virginia Real Estate Board (VREB) Regulation Key Changes: What Brokers need to know
On April 1, 2026, updates to the Virginia Real Estate Board regulations went into effect. There were several updates to…
May 7, 2026

What I Learned from Studying the Panamanian Real Estate Market — A Perspective for Fellow Realtors®
Hear from Charles Hoskins on his experience visiting Panama on a Trade Mission.
April 10, 2026

NVAR Adds Weekend Member Support for the Spring Market
To better serve our community during this high-demand time, NVAR is introducing remote weekend support hours, available from 10:00 AM…
April 3, 2026

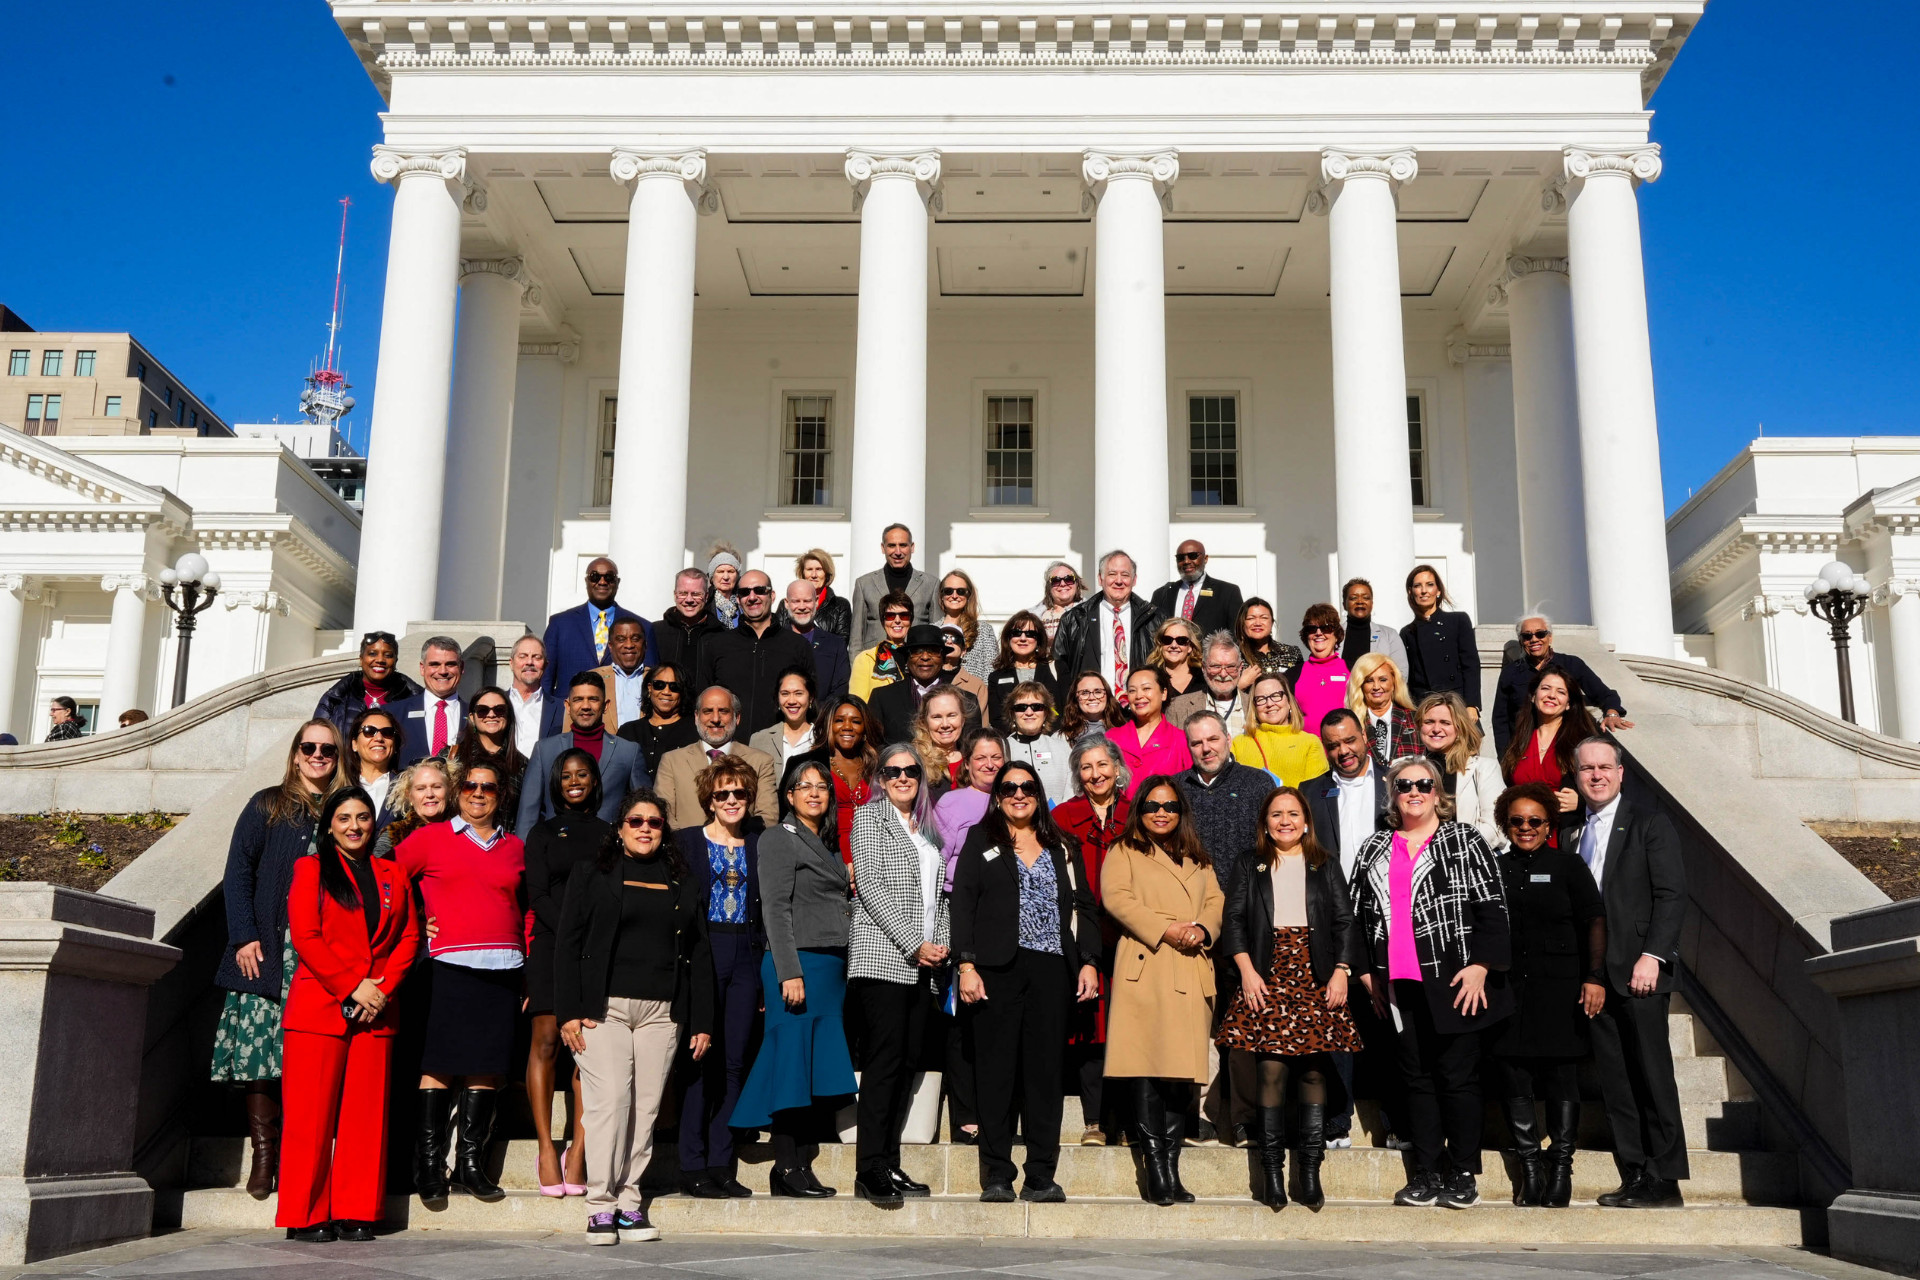
General Assembly Adjourns with Realtor® and Housing Success and Much Still Unresolved
The 2026 Session of the Virginia General Assembly officially adjourned sine die on Saturday, March 14, bringing to a close…
March 30, 2026
Virginia Real Estate Board Unveils Streamlined 2026 Regulations: What You Need to Know
On April 1, 2026, the Virginia Real Estate Board (VREB) is implementing a new, streamlined version of their regulations. The…
March 26, 2026

New Laws 2026: What You Need to Know From the 2026 Virginia General Assembly Session
The 2026 Virginia General Assembly delivered a consequential and, at times, historic session. Lawmakers convened on January 14, 2026, and…
June 16, 2026
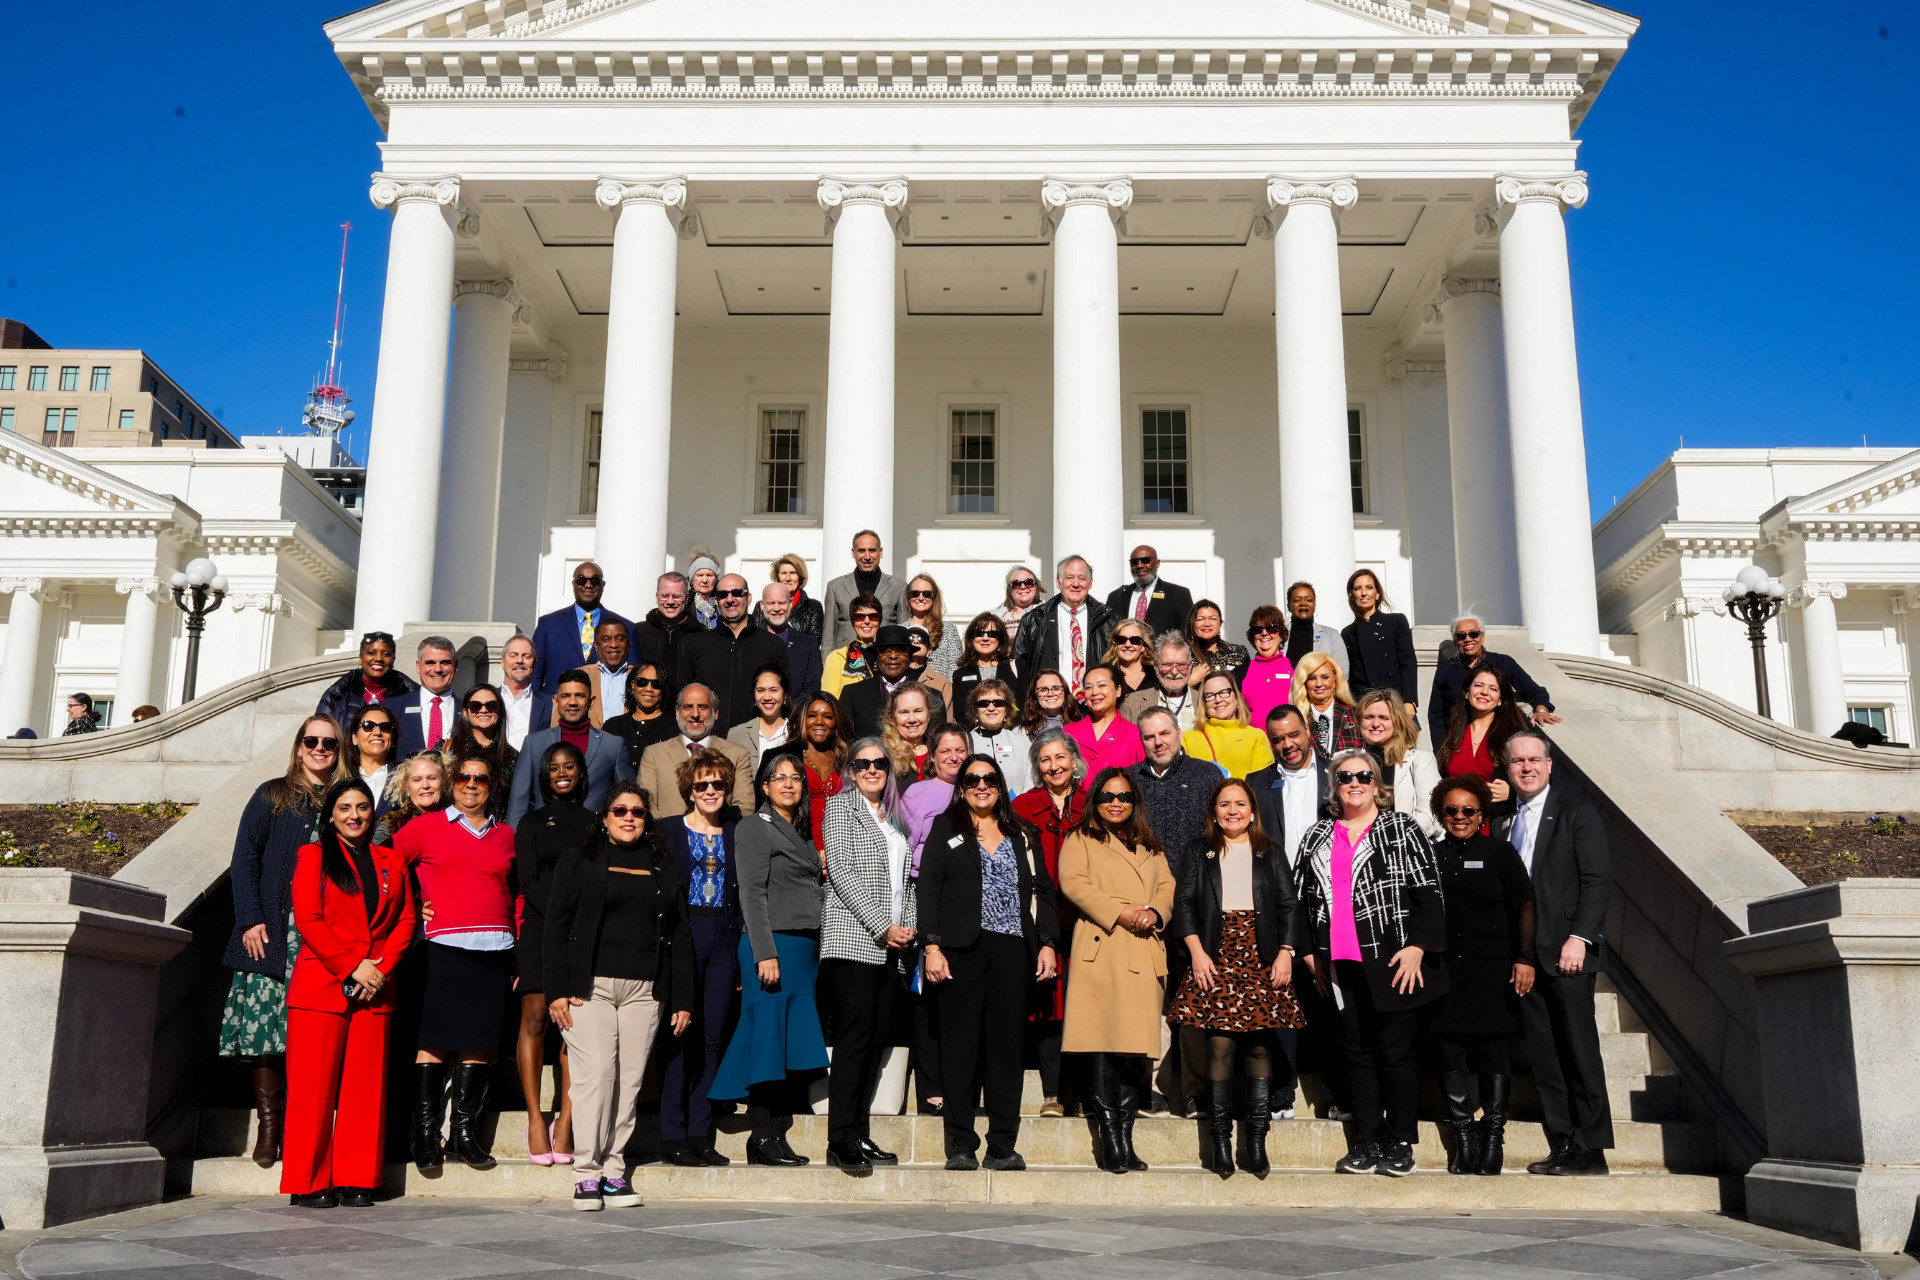
General Assembly Adjourns with Realtor® and Housing Success and Much Still Unresolved
The 2026 Session of the Virginia General Assembly officially adjourned sine die on Saturday, March 14, bringing to a close…
March 30, 2026
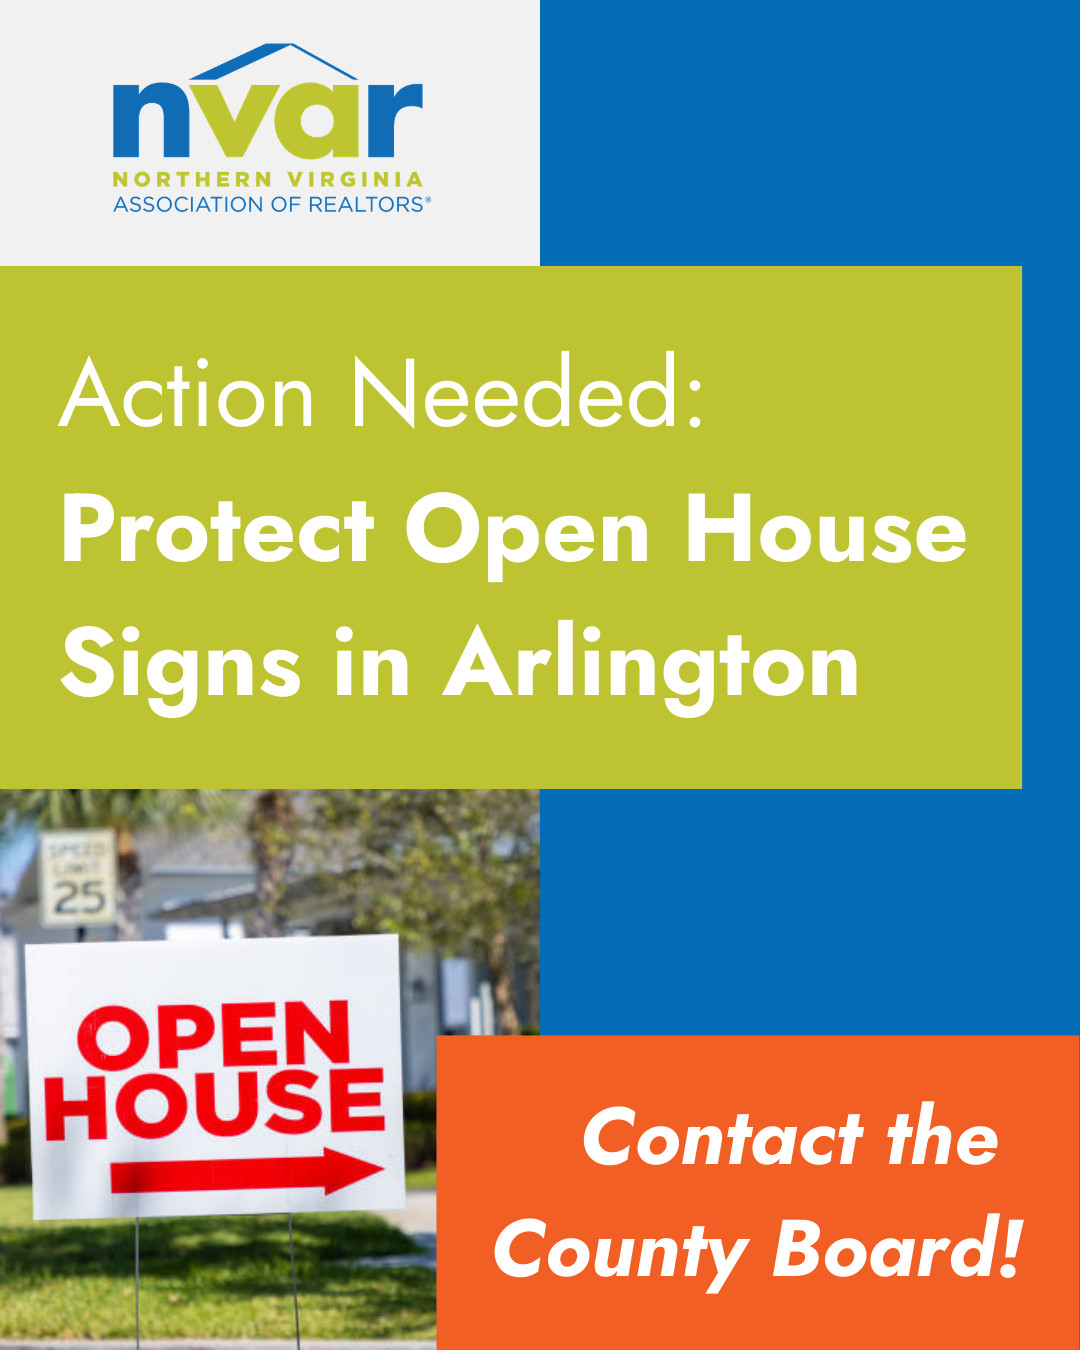
Action Needed: Protect Open House Signs in Arlington! Contact the County Board Today
Arlington County is considering a change to its sign regulations that could ban all temporary signs in the public right-of-way…
March 13, 2026
Fairfax County Realtors®: Take Fairfax County’s Survey on Accessory Living Units!
Fairfax County invites you to weigh in on its potential updates to zoning regulations for accessory living units. The accessory…
February 24, 2026

FIVE FOR FRIDAY: A Weekly Roundup of Public Policy News
Welcome to FIVE FOR FRIDAY: A weekly roundup of public policy issues and headlines from around the Northern Virginia Region,…
February 13, 2026
Stay Current with NVAR 2026 Standard Forms Updates
Staying current on NVAR Standard Forms is essential for real estate professionals. NVAR’s Standard Forms Updates classes are designed to…
June 9, 2026

Standard Forms Changes — July 1, 2026
The NVAR Board of Directors has approved new forms and forms changes, as proposed by the NVAR Standard Forms Committee.…
June 3, 2026

Standard Forms Changes — January 1, 2026
The NVAR Board of Directors has approved new forms and forms changes, as proposed by the NVAR Standard Forms Committee.…
December 3, 2025
Standard Forms Changes — July 1, 2025
The NVAR Board of Directors has approved new forms and forms changes, as proposed by the NVAR Standard Forms Committee.…
June 4, 2025
January 1, 2025, Standard Forms Updates
The NVAR Board of Directors has approved the below new forms and forms changes, as proposed by the NVAR Standard…
November 25, 2024
Bright MLS Updates — Coming Late July
On July 22, Bright MLS will be launching several important updates to their system and processes for when listings are…
July 1, 2026
Stay Current with NVAR 2026 Standard Forms Updates
Staying current on NVAR Standard Forms is essential for real estate professionals. NVAR’s Standard Forms Updates classes are designed to…
June 9, 2026
Standard Forms Changes — July 1, 2026
The NVAR Board of Directors has approved new forms and forms changes, as proposed by the NVAR Standard Forms Committee.…
June 3, 2026
FinCEN – An Update on the Residential Real Estate Reporting Rule
As part of the federal government’s efforts to protect the financial system and enhance national security, the Financial Crimes Enforcement…
March 25, 2026
NVAR Legal Hotline: Why Real-World Broker Experience Matters
In real estate, the right answer can make all the difference. From contract concerns to compliance questions, Realtors® face complex…
March 12, 2026


Looking for more expert analysis?
Virginia Association of REALTORS®
View the archive of Virginia REALTORS® press releases on housing market statistics, leadership and community engagement, and policy issues.
National Association of
REALTORS® News
Get the latest news from NAR, including press releases, REALTOR® Magazine articles, and blogs covering all aspects of real estate.
Real Estate News
Your NVAR membership includes a complimentary subscription to RealEstateNews.com. This valuable benefit provides Realtors® with access to objective, relevant, and industry-trusted news, enhancing their knowledge and keeping them informed about the latest developments.