Inventory in the NVAR Region
IT’S SPRING IN THE NATIONAL CAPITAL REGION. The cherry trees have blossomed, coats and sweaters are being replaced by shorts and t-shirts, and the peak home sales season has arrived for NVAR Realtors®. But will it flourish?
If you are working with a home seller in Northern Virginia, everything may be coming up roses. If the asking price is set appropriately, you are helping clients navigate multiple offers that arrive faster than mosquitos to a backyard party. On the other hand, if you are working with a potential buyer, whether they have lived here a lifetime or just arrived, you are almost certainly starved for options to show and have become a de-facto grief counselor as clients get out-bid on the few properties available. In this market overview, we dig into the decline in listed properties that has impacted almost all NVAR submarkets and has led to historically low inventory in many D.C.-area neighborhoods.
In late 2018, we received the remarkable news about Amazon HQ2 coming to Crystal City, followed quickly by the longest shutdown to date of the federal government. Local market forecasters, including the George Mason University Center for Regional Analysis (CRA) forecasters who work in partnership with NVAR, suffered repeated bouts of economic whiplash resulting in altered market activity outlooks for 2019.
The underlying good news is that the regional economy is in great shape. Unemployment remains very low; wages are rising, particularly for professional households employed in the private sector; mortgage rates have dropped; and the job growth outlook remains positive – if somewhat slower than the last three years.
However, there is also less positive news. Even though most federal employees will get back the earnings missed during the shutdown, the extended disruption in income has hurt home- buyer confidence among the federal workforce and employees of government contractors. Housing prices are keeping some potential buyers out of the market. Wages have risen but not enough to offset housing price increases. Nor have wages risen enough to fix the debt-to-income challenges of younger households burdened with excessive school debt.
Here are the key factors that may be affecting inventory levels in the NVAR market, in no particular order:
- The Amazon HQ2 announcement:
- Sparked a surge in speculative buying.
- Caused some homeowners to wait until HQ2 hiring really takes off to sell their homes (2019-2020).
- Housing construction is still not keeping up with population growth.
- With limited move-up or downsizing opportunities, many would-be sellers are staying on the sidelines.
- The proportion of retirees who move away is declining as more senior residents decide to stay closer to existing networks of family and friends.
- Though not large, an increasing number of homes for sale never hit MLS listings and thus do not appear as inventory in the data.
The charts and maps below show that Realtors® in the NVAR market will likely face increasing challenges in finding suitable properties for their clients, though the story is not uniform for all submarkets.
OVERALL INVENTORY
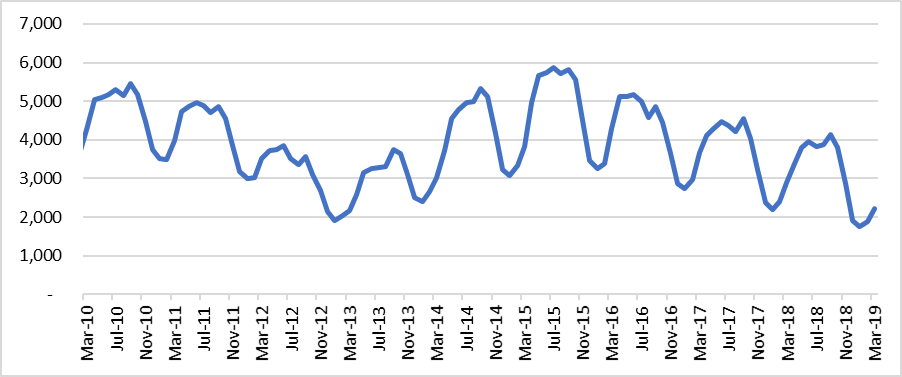
Housing inventory has recently been at historic lows in the NVAR region, which includes Alexandria City, Arlington County, Fairfax County, Fairfax City and Falls Church. The number of active listings in January 2019 in the NVAR region was the fewest since at least the start of 2010 (Figure 1). There were only 1,757 active listings in January 2019. While active listings increased to 2,227 in March 2019, this represented the fewest March active listings since March 2013, when there were 2,159 listings.
Figure 1. Active Listings in the NVAR Region: All Homes
Sources: Bright MLS, GMU-Center for Regional Analysis
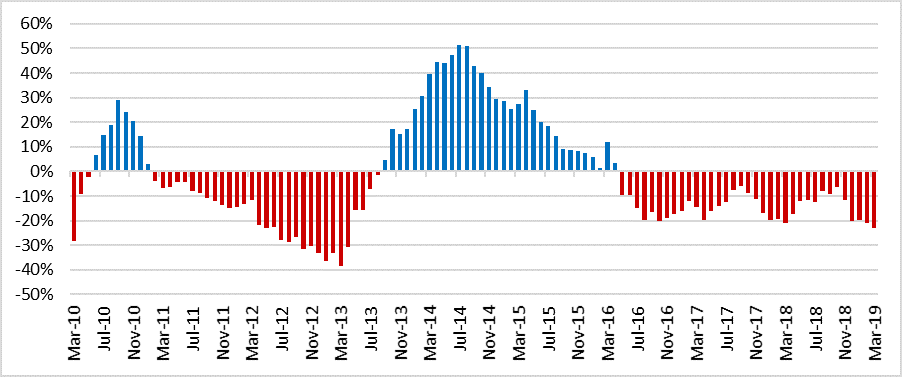
The steady decline in active listings in the NVAR region appears likely to continue. In the past decade, there have been two periods of notable inventory tightening. The first period began in February 2011 and ended in August 2013. The second period started in May 2016 and has continued through the present day (Figure 2). During the first period, inventory declined year-over-year for 31 consecutive months. For the current period, the number of active listings has fallen year- over-year for 35 consecutive months. While the late stages of the first tightening period only saw small year-over-year declines in active listings, the most recent months of the current period have recorded among the largest year-over-year percentage declines. Inventory decreased year-over-year by 20 percent in December 2018, 20 percent in January 2019, 21 percent in February 2019, and 23 percent in March 2019.
Figure 2. Year-Over-Year Percent Change in Active Listings: All Homes
Sources: Bright MLS, GMU-Center for Regional Analysis
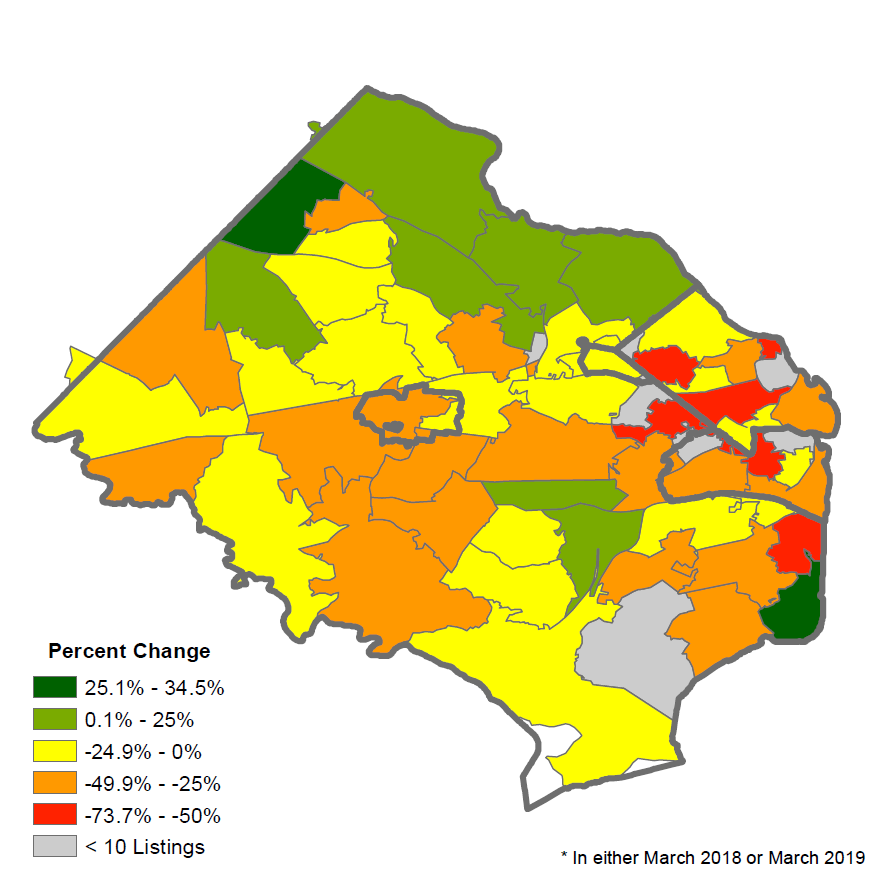
While recent inventory declines have been among the largest during the current tightening period, some areas of the NVAR region recorded increases in inventory. From March 2018 to March 2019, the number of total active listings declined the most in Arlington and Alexandria (Figure 3). Inventory increased in a number of ZIP Codes north of interstate 66 with the largest increases in inventory occurring in the ZIP Codes around Mt. Vernon and Herndon.
Figure 3. Percent Change in Total Active Listings: March 2018-2019
Sources: Bright MLS, GMU-Center for Regional Analysis
DETACHED HOMES
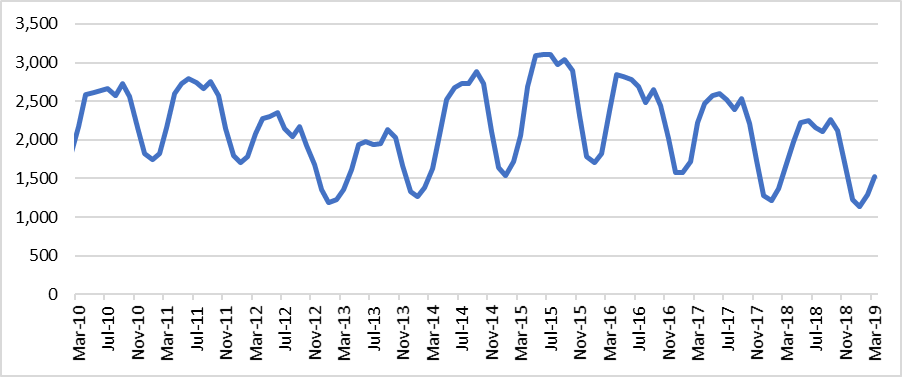
Detached homes make up the majority of total active listings in the NVAR region and have, unsurprisingly, mirrored the overall trend. The number of active listings has trended downward since the most recent peak of 3,110 active listings of detached homes in June 2015 (Figure 4). As with total active listings, the 1,130 active listings of detached homes recorded in January 2019 was the fewest active listings since at least the beginning of 2010. While the number of active listings increased through March, the 1,524 active listings in March 2019 was the fewest March active listings since March 2013, when there were 1,356 listings.
Figure 4. Active Listings in the NVAR Region: Detached Homes
Sources: Bright MLS, GMU-Center for Regional Analysis
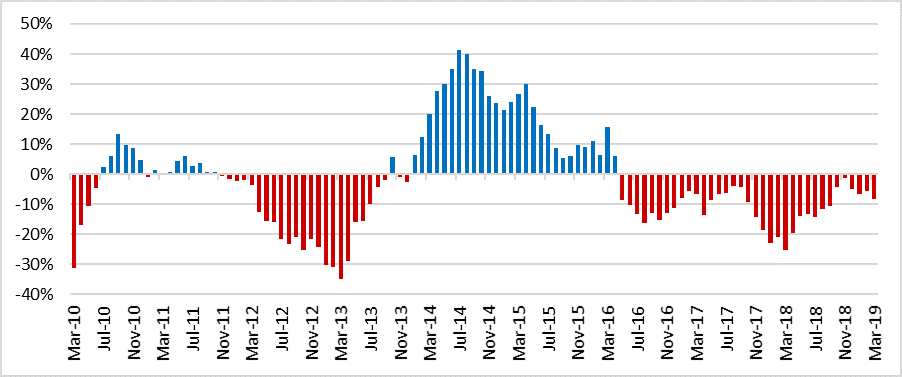
Despite following the overall trend of active listings in the NVAR region, detached homes deviated slightly from all home types in the most recent tightening period. The most notable deviation is from November 2018 through March 2019 when the number of active listings of detached homes declined less severely than all home types (Figure 5). During this period, the number of active listings of detached homes declined between 1 percent and 8 percent year- over-year each month. In contrast, the number of active listings of all home types declined between 12 percent and 23 percent year- over-year each month during the same period. Overall, inventory of detached homes did not tighten as much as townhomes and condos.
Figure 5. Year-Over-Year Percent Change in Active Listings: Detached Homes
Sources: Bright MLS, GMU-Center for Regional Analysis
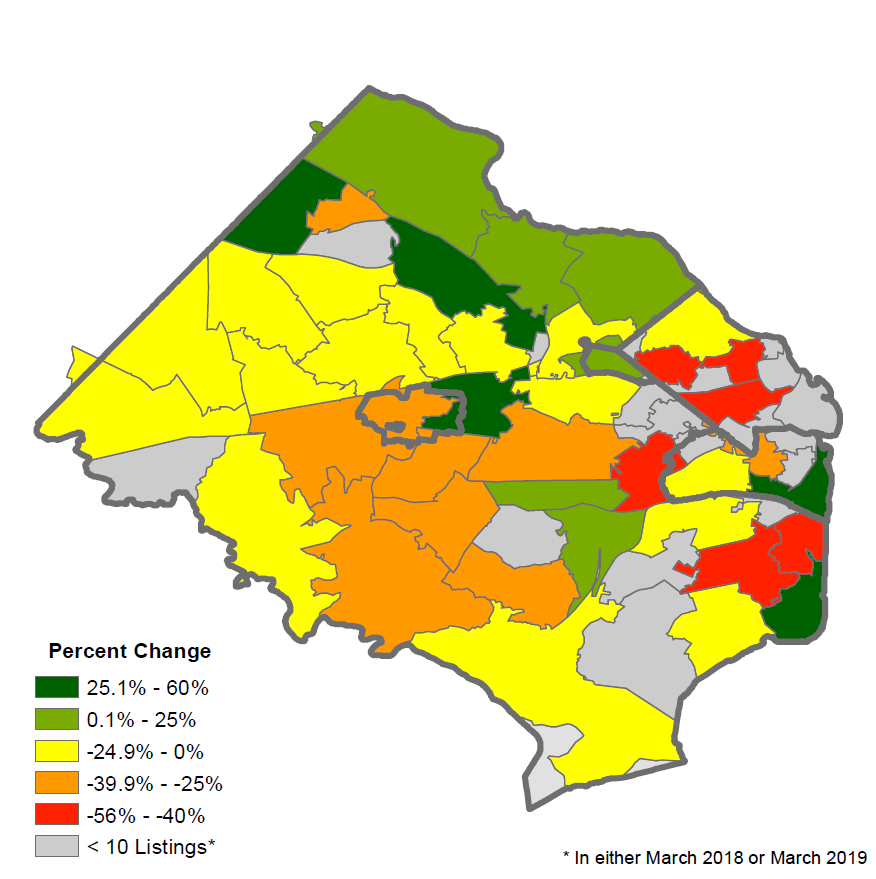
Changes in inventory of detached homes across the NVAR region from March 2018 to March 2019 only differed from total inventory changes in a few areas of the region. During this period, the decline in active listings of detached homes was more severe in areas of central Fairfax County around Springfield than all home types (Figure 6). Perhaps the most notable differences were in southeast Alexandria and eastern Fairfax City where the number of active listings of detached homes increased from March 2018 to March 2019. In contrast, overall inventory declined in both areas. Despite the differences, the general trend of increased inventory north of interstate 66 is apparent in the inventory of detached homes and all home types.
Figure 6. Percent Change in Active Listings of Detached Homes: March 2018-March 2019
Sources: Bright MLS, GMU-Center for Regional Analysis
TOWNHOMES
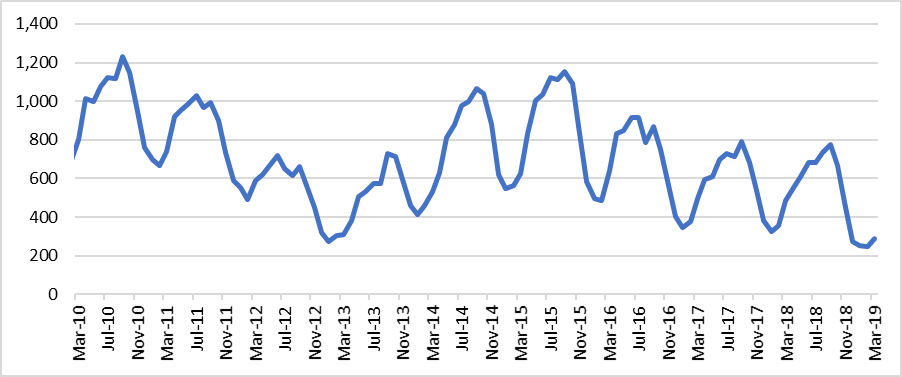
Active listings of townhomes in the NVAR region deviated only subtly from the overall trend. The first deviation is that the number of active listings of townhomes peaked much earlier than detached homes and condos (Figure 7). Active listings of townhomes peaked at 1,230 in September 2010 while active listings of detached homes and condos peaked in the summer of 2015. Despite this, the 1,153 active listings of townhomes in September 2015 was only 77 listings fewer than the previous peak. The second deviation was that the fewest active listings of townhomes since the beginning of 2010 occurred in February 2019 when there were only 248 active listings in the NVAR region. The fewest active listings of all home types occurred in January 2019, though this was driven entirely by detached homes.
Figure 7. Active Listings in the NVAR Region: Townhomes
Sources: Bright MLS, GMU-Center for Regional Analysis
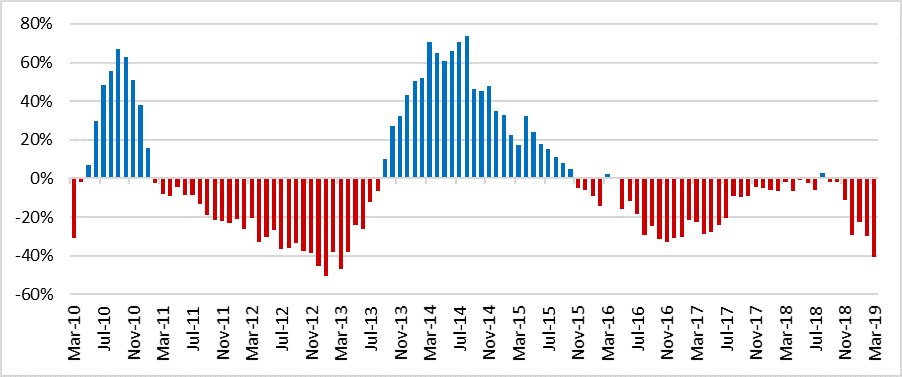
Differences between active listings of townhomes and all home types are most apparent in year-over-year percent changes (Figure 8). In 2018, the number of active listings of townhomes in the NVAR region declined an average of 6 percent year-over-year each month – far below the 14 percent average decline in active listings of all home types over the same period. In contrast, the number of active listings of all home types declined an average of 14 percent year-over-year each month during the same period. The relatively small year-over- year inventory declines for townhomes were interrupted when the number of active listings increased year-over-year in August 2018. Active listings of detached homes and condos have not recorded a year-over-year increase since May 2016.
Figure 8. Year-Over-Year Percent Change in Active Listings: Townhomes
Sources: Bright MLS, GMU-Center for Regional Analysis
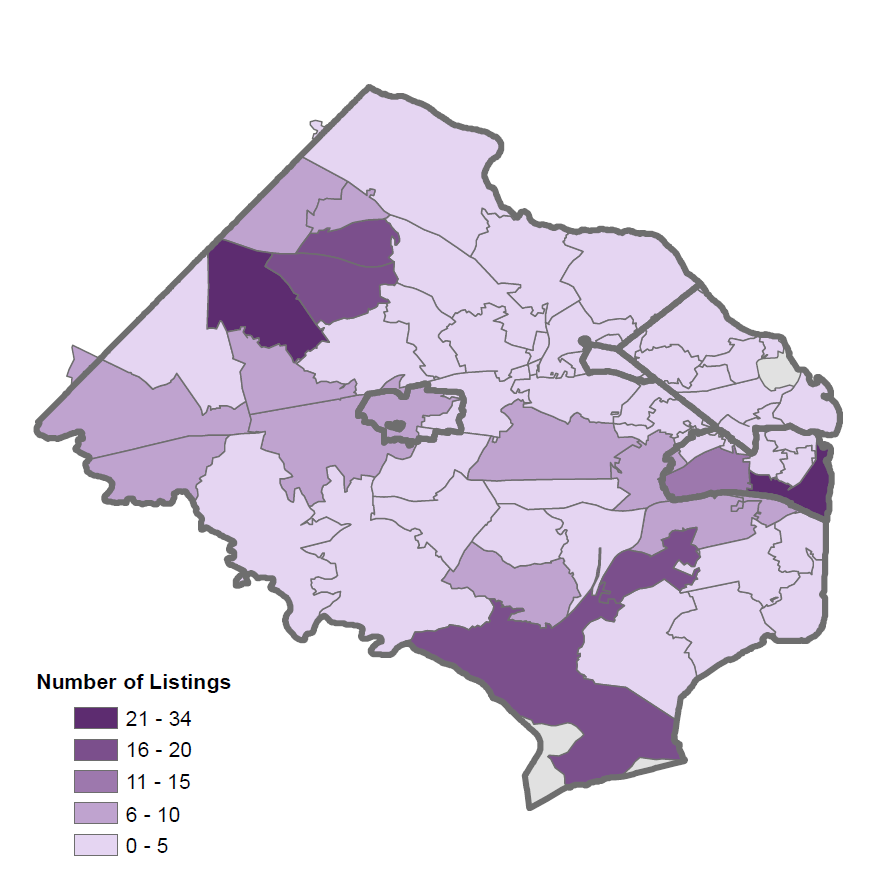
The number of active listings for townhomes has declined to nearly zero in the majority of individual ZIP Codes in the NVAR region (Figure 9). Low active listings result in large swings in percent changes, resulting in the number of listings being reported. There are only three areas of the NVAR region with notable supplies of active townhome listings. The area with the most active listings of townhomes is southeast Alexandria, with 34 active listings in March 2019. The other two areas with relatively large supplies of townhomes are along interstate 95 south of Alexandria and in western Fairfax County.
Figure 9. Townhome Active Listings: March 2019
Sources: Bright MLS, GMU-Center for Regional Analysis
CONDOS
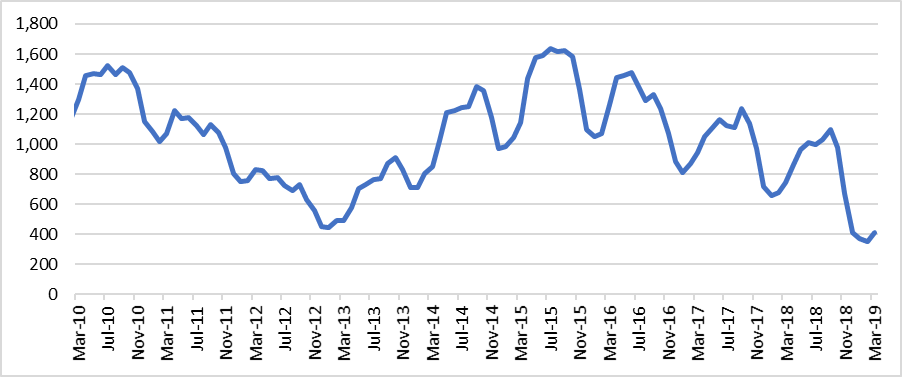
Following the trend of all home types, the number of active listings of townhomes has trended downward since reaching a peak of 1,639 units in July 2015 (Figure 10). In contrast with detached homes, the fewest number of active listings of condos since the beginning of 2010 occurred in February 2019, when there were only 353 condos actively listed in the NVAR region before increasing to 410 in March 2019. Unlike the inventory levels of 2010 through mid- 2013, the inventory of condos in the region has developed a seasonal pattern similar to other market segments.
Figure 10. Active Listings in the NVAR Region: Condos
Sources: Bright MLS, GMU-Center for Regional Analysis
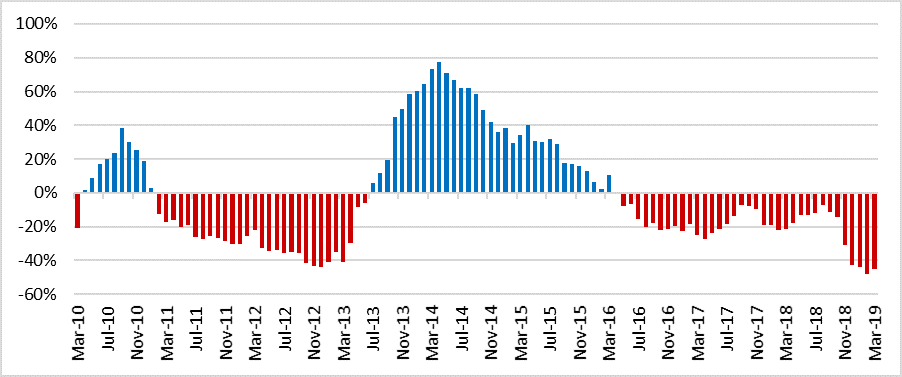
The recent year-over-year declines were the most severe among the three home types (Figure 11). The steep declines in active listings of condos began in November 2018 when there were 38 percent fewer active listings than the same month the year prior. This tightening only worsened in the following months; active listings declined year-over-year 42 percent in December 2018, 44 percent in January 2019, 48 percent in February 2019, and 45 percent in March 2019. The relatively small declines in active listings of detached homes mentioned previously was outweighed by the significant declines in active listings of condos beginning in November 2018.
Figure 11. Year-Over-Year Percent Change in Active Listings: Condos
Sources: Bright MLS, GMU-Center for Regional Analysis
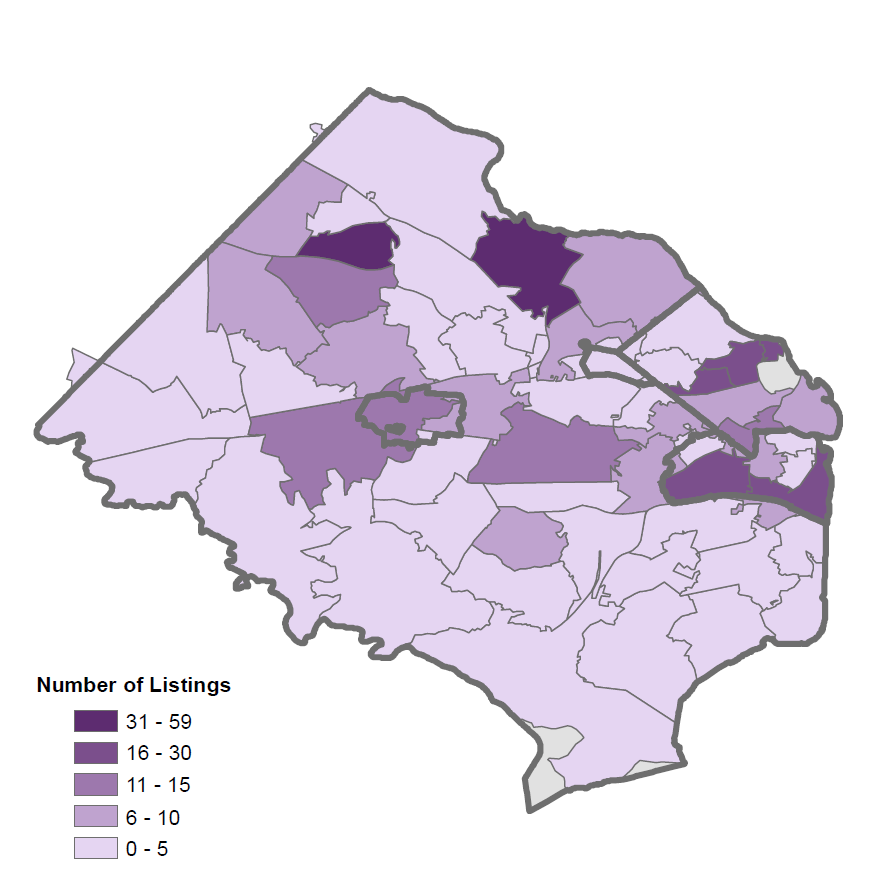
The number of active listings of condos among ZIP Codes in the NVAR region has declined to nearly zero in the majority of ZIP Codes (Figure 12). The only areas with substantive active listings in condos in March 2019 were Reston, western McLean, central Arlington and southern Alexandria. However, the number of listings in these areas is still historically low. The ZIP Code with the most active listings in March 2019 was Reston’s 20190 with 72 active listings.
Figure 12. Condo Active Listings: March 2019
Sources: Bright MLS, GMU-Center for Regional Analysis
OUTLOOK
There should be two or three condominium projects in Northern Virginia delivering over the next several months that will boost inventory, largely in the luxury market. Otherwise, the CRA does not see new construction delivery in ownership housing units alleviating our current inventory challenges. In a recent meeting of the NVAR Forecast Advisory Committee, which is a group of NVAR members, NVAR staff and CRA economists, the consensus was that recent inventory trends will continue at least through the end of 2019 – meaning the supply of available for-sale properties will continue to decline. Competition for listings will intensify and some sellers will likely ask for increasingly competitive concessions from listing agents. With a few notable exceptions, the peak bloom of for-sale signs in Northern Virginia will not be a show stopper this year.