First Quarter Metrics for New Home Sales in Northern Virginia Reflect a Vibrant Market
Low inventory continues to affect both the NVAR region (comprised of Alexandria City, Arlington County, Fairfax County, Fairfax City and Falls Church City) and the national residential real estate markets. Within the NVAR region, the rate of year-over-year change in active listings has declined continuously since May 2016, and January 2017 saw the lowest inventory number in three years.
Tight inventory is the result of high demand and the shrinking number of available homes for sale, as total sales consistently surpass the number of new listings. The inventory of some home types was increasingly tight, including single-family attached properties and lower-priced properties. The negative growth rate in active listings eased during the winter months of December, January, and February, but if the typical spring increase in new listings continues to lag behind sales, inventory will continue to contract.
“As the housing market tightens, homes are selling at increasingly faster rates.”
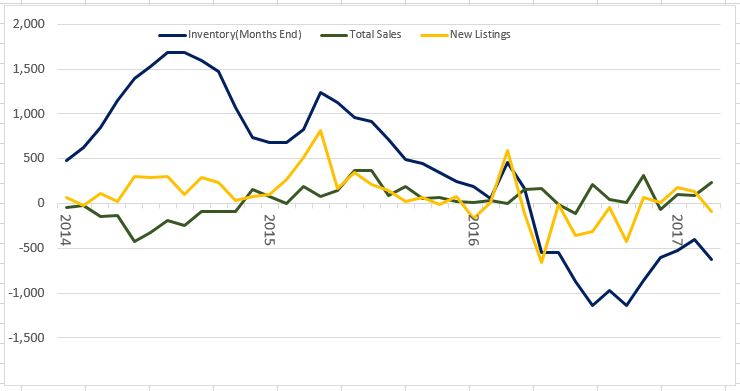
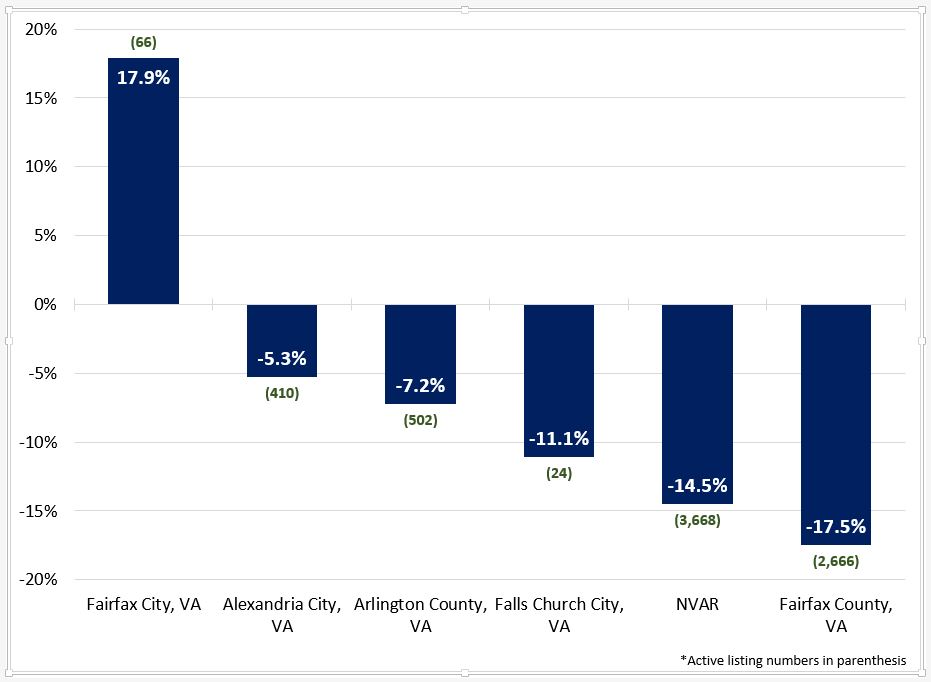
Between March 2016 and March 2017, active listings declined 14.5 percent, leaving a total active inventory of 3,668 homes. The year-over-year growth rate has declined since April 2015 and has gone negative since May 2016, having declined 20.4 percent at its bottom in October 2016.
Unsold active listings at months’ end (otherwise known as housing inventory), are composed of closed sales and new listings added each month. Beginning in 2015, total closed sales began tracking closely with new listings, thereby reflecting slower inventory growth. Early 2016 saw a typical spring recovery with a spike in new listings before the summer buying season.
However, a 17.1 percent drop in new listings followed with a corresponding triple digit year-over-year increase in sales during the summer months. March, 2017 numbers display a similar trend occurring as we move into the second quarter. This increased buyer demand—combined with lack of new supply—contributes to an inventory shortage, as there were only 2.0 months of supply in February. In other words, it would take two months to sell the current inventory at the current sales pace.
MEDIAN DAYS ON MARKET REFLECTS LOW INVENTORY
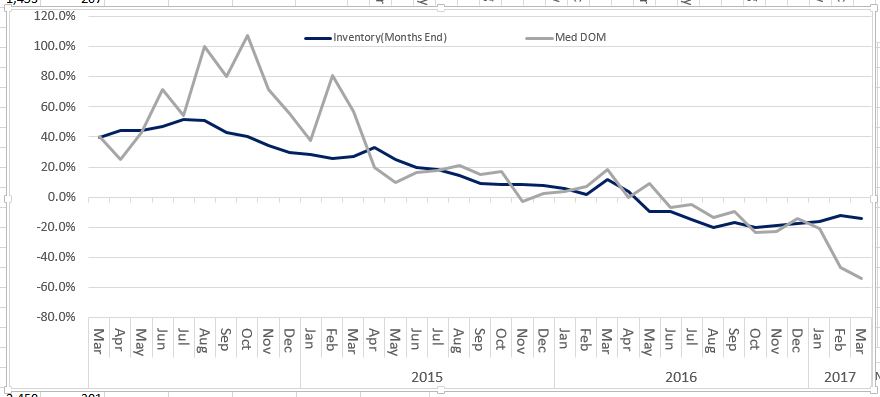
As the housing market tightens, homes are selling at increasingly faster rates. The median number of days on market (DOM) for NVAR region homes in March 2017 was 12 days—14 days lower than the prior March and the largest year-over-year decrease since March 2013. The length of time a house sits on the market typically increases during the winter months.
However, this past winter proved different as median DOM increased slightly, but still continued at a rapid rate of decline. Mild weather likely contributed to this market activity, as unseasonably warm weather set records. This should set up a spring and summer market that will likely see inventory turnover at record speeds.
RAPIDLY DECLINING INVENTORY OF SINGLE-FAMILY ATTACHED HOMES AND CONDOS
Among all housing types, there were fewer months of supply in March 2017 than one year prior. This is a trend that has persisted since May 2016. Single family detached homes comprised the majority of active listings with 2,226 homes for sale in March, a decrease of 6.5 percent from the previous year. These types of homes typically drive the total inventory numbers, and stand now at a three-year March low of 2.8 months of supply.
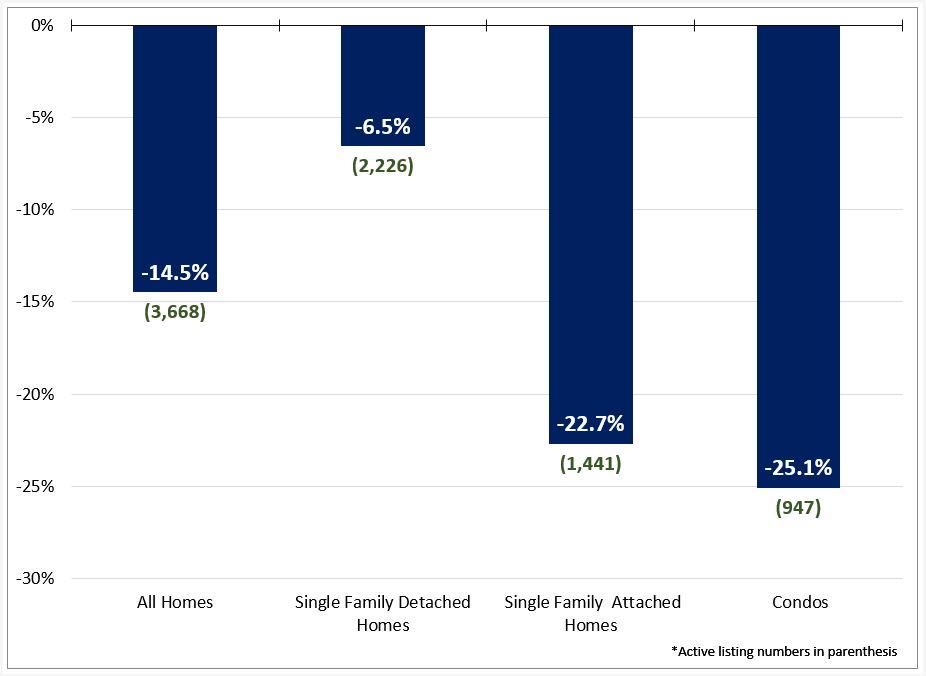
Condos and attached single family home inventory also decreased from March 2016 to March 2017 leaving 1.8 and 1 months of supply, respectively. Condo inventory decreases are primarily the result of high demand.
New condo listings decreased 12.5 percent from March 2016, while closed sales increased 15.8 percent during the same period. Single-family attached homes were the tightest market segment, as inventory decreased 22.7 percent from March 2016. This left only 494 single family attached homes on the market at the end of March. Given the increasing sales numbers and the 572 April 2016 sales, we can expect a continued tightening of supply of single-family attached homes in our NVAR footprint.
LOW TO MID-PRICED PROPERTIES ARE IN SHORT SUPPLY
The NVAR region’s inventory increasingly favors high-priced properties, and therefore higher income buyers. March 2017 had the highest median active listing price ($719,995) in more than a decade.
The largest share of inventory (1,096 homes) is priced above $1 million, and homes at this price point increased the most at 3.5 percent from last year. This is the highest number of million dollar home listings in February in more than ten years.
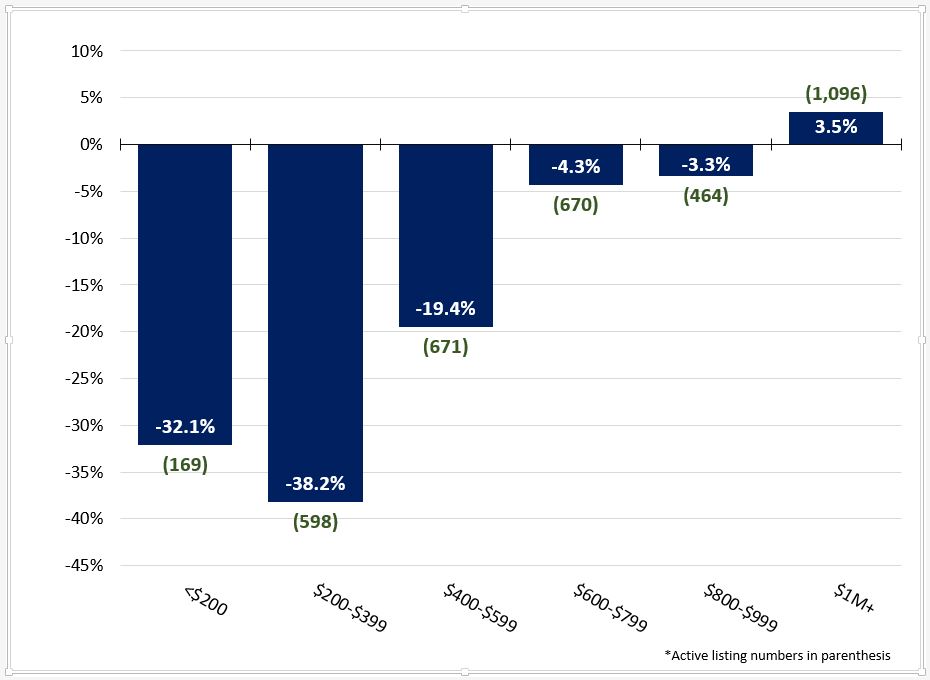
At the current rate of sale, lower-priced properties from $200,000 to $399,999, and properties in the $400,000-$599,999 range have about one month supply, and they have decreased at a relatively fast rate (-19.9 percent to -41.6 percent from March 2016). Inventory of mid-priced properties ($600,000-$799,999) shows signs of stabilization, yet still remain at 2 months’ supply.
New listings in the spring will help to replenish the housing supply, but this may slow as owners of lower priced homes are less likely to vacate and sell if they cannot afford the homes on the market. High demand for lower and middle priced homes will absorb much of the new supply as the spring progresses, depleting inventory further.
FAIRFAX COUNTY SAW THE LARGEST INVENTORY DECLINE
Largely due to its population, Fairfax County comprised the majority of inventory in the NVAR region, at 2,666 homes and 2 months’ supply. Fairfax County also saw the largest reduction in active inventory from March 2017. Inventory in the City of Fairfax rose 17.9 percent from last March, its first gain in year-over-year active listings since September 2015. However, housing change statistics for the cities of Fairfax and Falls Church can be volatile due to low volume. Mimicking the region, Alexandria and Arlington both saw their 19th straight month of year-over-year decline in inventory. Alexandria and Arlington face unique challenges as smaller urban communities, with limited land to develop, constraining inventory.
While there is much discussion about converting unused office space into residential units, and there are some conversion projects in the planning pipeline, it will be some time before such units come onto market. Of course, the redevelopment of office space will do little to get more folks in the mood to sell their single family homes in our premier Northern Virginia locations such as Alexandria and Arlington – especially given our love affair with our historically-cheap mortgages we have on our current homes
INVENTORY EXPECTED TO CONTINUE ITS CONTRACTION, BUT REGIONAL ECONOMIC UNCERTAINTY REMAINS
New listings grew faster than sales in the winter months of 2016-2017, as reflected in the recent upward trend in year-over-year inventory growth. Despite the 14.5 percent decline in active inventory in March, the number of new listings, at 23,668, is 8.1 percent higher than the 5-year February average of 3,392. However, the number of new pending sales increased year-over-year 5.3 percent to 1,832 in February and 6 percent to 2,606 in March, serving as a potential indicator of increasing future home sales. Supply has seen a lull in its downward spiral, but demand looks poised to continue rising.
“Supply has seen a lull in its downward spiral, but demand looks poised to continue rising.”
Contract ratio compares the total number of homes under contract in a given period to the overall number of active listings. A higher ratio signifies a relative increase in contracts compared to supply, and indicates the market is moving in the sellers’ favor. The contract ratio of 0.84 in March 2017 signals that 84 percent of homes on the market in the NVAR region were under contract and ready to close. This is the highest contract ratio since March 2014, and a sign that—barring any significant shift in the local economy—the region can expect inventory to continue contracting absent a significant increase in new inventory.
However, the change in Administration has the potential to alter the scale of federal employment and contracting, which could create uncertainty about the region’s future economic trajectory. Significant reductions in federal employment and employment opportunities might limit the extent to which many workers are willing to move to, or remain in, the NVAR region.
This might also further limit supply as existing homeowners could become reluctant to move due to financial limitations. Regardless, it will take some time for these developments to fully impact the housing market. As a result, in the short term the real estate market this spring is shaping up to continue strongly in sellers’ favor.
Spencer Shanholtz is a research associate at the George Mason University Center for Regional Analysis