MIDWAY THROUGH 2018, the Northern Virginia Association of Realtors® region (comprised of Alexandria City, Arlington County, Fairfax County, Fairfax City and Falls Church City) has experienced steady economic growth, constricting inventory, and moderate increases in home sales and prices. Economic expansion supported by consistent regional job growth continues to boost housing activity and provides the basis for stronger demand. The region’s extremely limited inventory suppresses home sales but maintains high prices. Throughout the remainder of 2018, we can expect subdued sales growth, as there appears to be no immediate relief from the limited supply of homes.
STEADY JOB GROWTH, YET CONCERNS OVER WAGES
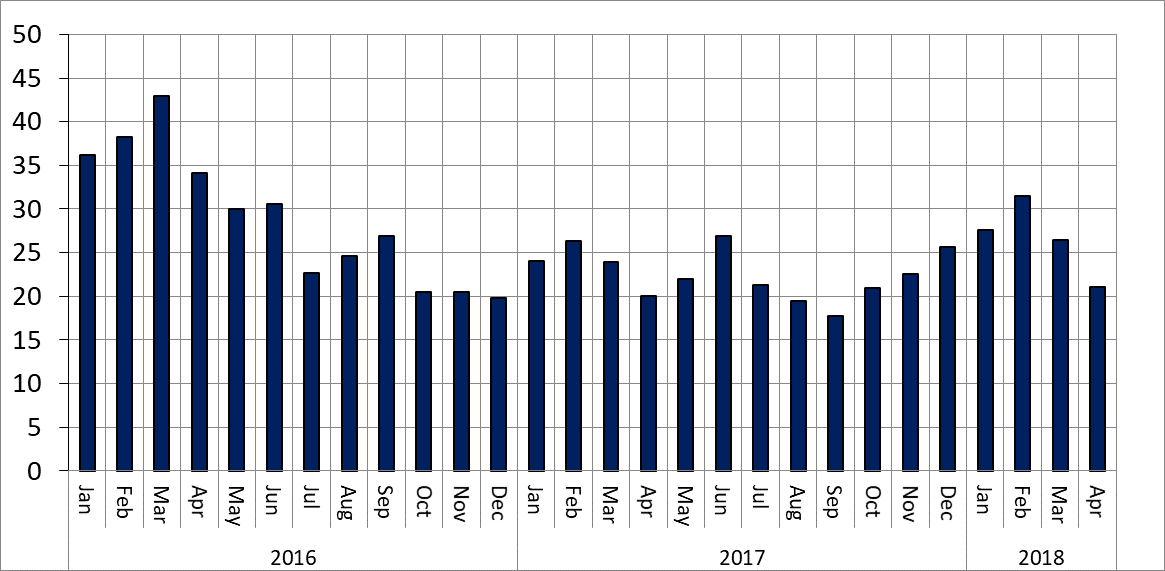
Northern Virginia (defined as the counties of Arlington, Clarke, Fairfax, Fauquier, Loudoun, Prince William, Spotsylvania, Stafford and Warren and the cities of Alexandria, Fairfax, Falls Church, Fredericksburg, Manassas and Manassas Park) displayed steady job growth throughout 2017 – albeit slower than the first half of 2016 (Figure 1). This stagnant growth trend can be attributed, in part, to record low unemployment rates with the economy approaching full employment.
Figure 1. Year-Over-Year Job Change, Northern Virginia
(in thousands)
Source: U.S. Bureau of Labor Statistics
Northern Virginia job growth has shown an uptick during the first quarter of 2018, with 2.2 percent employment growth, led in part by the addition of 31,500 net new jobs between February 2017 and February 2018. Growth slowed somewhat moving into April 2018 but remains on par with the past few years; the region gained nearly 21,100 jobs and grew 1.5 percent since April 2017. Where employment grows, housing demand typically follows. However, this is contingent on the types of jobs being added (e.g., high wage jobs in growth sectors versus low wage, locally serving sectors) as well as positive demographic and migration trends.
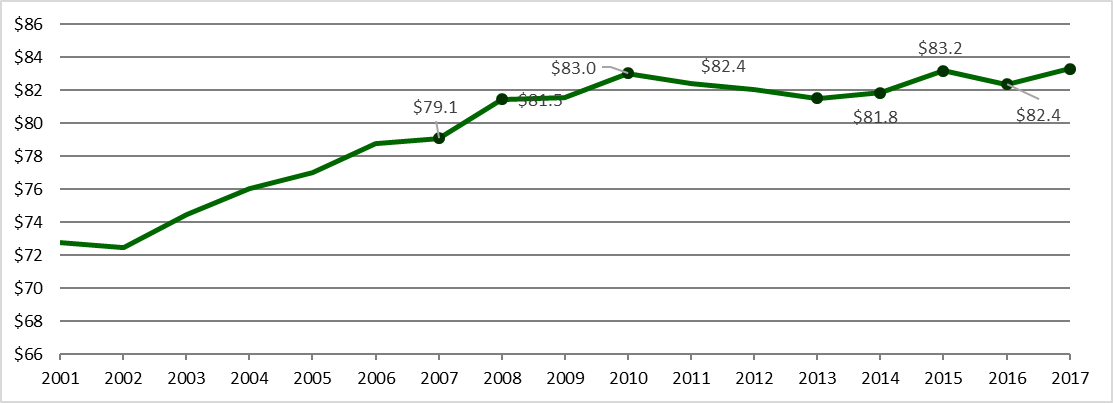
The average wage in the NVAR region has remained stagnant over the past seven years with a 0 percent average annual growth rate. The wage has reached a record high, but is only slightly over the 2015 peak of $83,200 (Figure 2). However, since 2014, wages have increased 1.8 percent, and between 2016 and 2017, the average annual wage increased 1.1 percent to $83,000 when adjusted for inflation.
Figure 2. Average Wage, NVAR Region
(in thousands of 2017 $s)
Source: U.S. Bureau of Labor Statistics, *adjusted for inflation using annual Consumer Price Index
Among NVAR jurisdictions, Falls Church saw the fastest wage growth at 5.9 percent since 2016, and it now has an average wage of $69,742. Arlington has the region’s highest average wage ($88,688), and it has increased 3.2 percent over the past year, with similar growth numbers for Fairfax County. Depending on the sector composition of job growth in the first four months of 2018, described as follows, average wages have the potential to rise throughout the region.
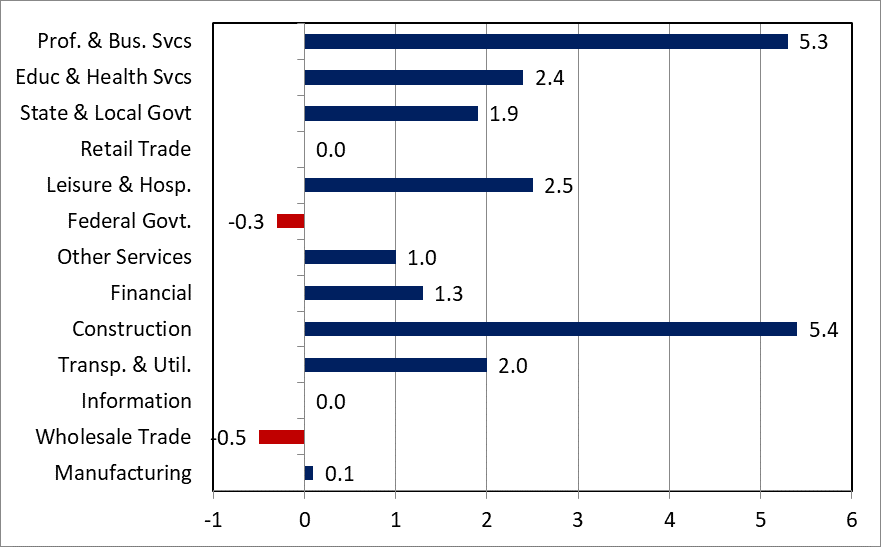
The high-paying professional and business services sector continues to drive NVAR regional job growth, but not as much as in prior years. Over the past year, this sector accounted for almost one out of every four net new jobs created in Northern Virginia between April 2017 and April 2018 (Figure 3). This is compared to nearly half of all jobs created over the same period between 2016 and 2017. Given its high annual average wages – over $112,190 in 2017 – continued growth of the professional and business services sector will be vital for growing regional wages.
Figure 3. Job Change April 2017 to April 2018, Northern Virginia
(in thousands)
Source: U.S. Bureau of Labor Statistics
With an average regional wage of $113,710, the federal government continues to be an important source of good paying jobs. However, Northern Virginia lost more than 1,000 federal government jobs over the past year and this is its 13th straight month of year-over-year decline. This inevitably has had a negative effect on overall regional wage growth and the ability for many to purchase new homes.
Construction is another sector showing increasing growth relative to last year, as the sector gained 5,400 net new jobs between April 2017 and April 2018. This growth represents just over one quarter (26 percent) of the region’s growth during that period. This sector has a moderate average wage of $71,285, which is about 85 percent of the regional average, yet higher than most. Construction jobs are also a source of well-paying employment for those without extensive postsecondary education, and potentially allow those workers to enter the housing market. Furthermore, increased construction hiring can indicate greater builder confidence, which in turn can lead to more home construction and greater housing inventory.
The region also continues to add jobs in lower-paying sectors. For instance, the leisure and hospitality sector, which typically creates relatively low-wage, part-time and seasonal jobs, added 2,500 net new jobs between April 2017 and April 2018. This sector is the region’s fourth largest employing sector, but only pays annual average wages of $24,450 in the NVAR region – a wage that has decreased nearly 20 percent over the past year. Workers in these lower-wage sectors typically cannot afford homes in Northern Virginia, and often they must commute from outside the region. As a result, disproportionate growth in lower wage jobs can subdue home sales.
REGIONAL POPULATION GROWTH HINDERED BY NET DOMESTIC OUTMIGRATION
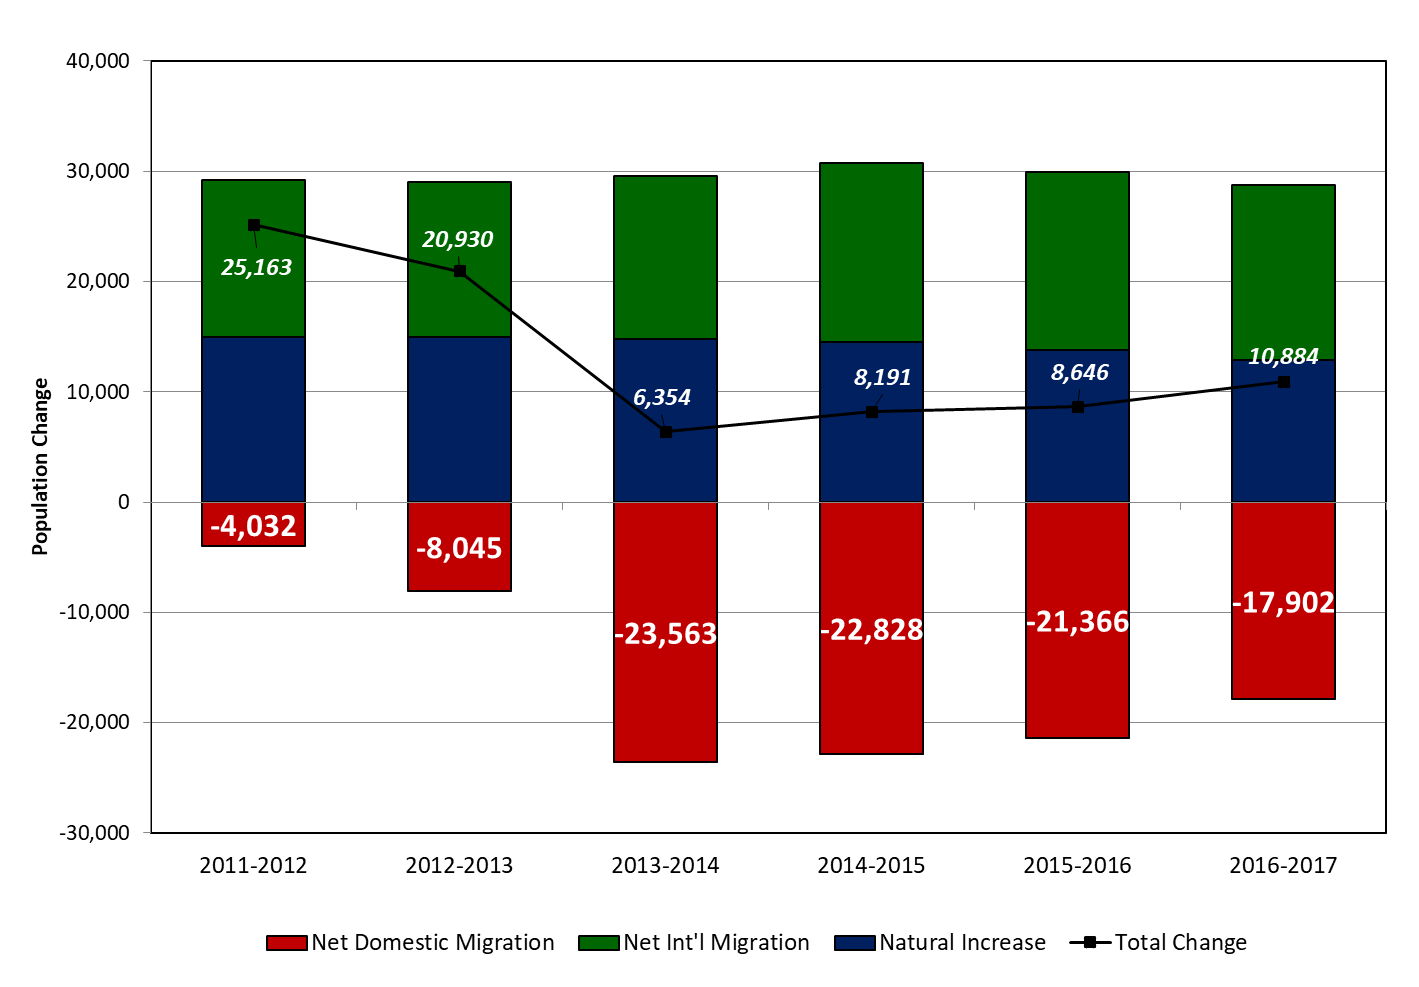
The NVAR region’s population grew relatively slowly between 2016 and 2017, compared to past growth, at a rate of 0.7 percent. This is on par with the national growth rate of 0.72 percent and the state growth rate of 0.6 percent over the same period. During this time, the region added 10,884 new residents (Figure 4). This is a significantly slower pace of growth than what the region experienced between 2010 and 2013, but it is consistent with the region’s growth trends since 2014.
Figure 4. Population Change, NVAR Region
Source: US Census Bureau, Population Estimates Program, V2017
There are three components of population change – natural increase (births minus deaths), domestic migration and international migration. When a region gains new employment and resident workers, the corresponding changes in the population can serve as an indicator of regional attractiveness, potential housing demand and economic stability.
One of the region’s more pressing trends has been net domestic outmigration. Since 2011, the region has lost more domestic residents than it has gained. This trend has slowed the region’s overall population growth, as domestic residents are increasingly finding opportunities to live and work elsewhere. In 2017, almost 18,000 more people left the NVAR region than moved into the region from elsewhere in the U.S. This trend has slowed over the past three years, but it remains an important regional challenge. This large departure rate raises concern about the region’s affordability and attractiveness as a place to live and work, and it continues to pose a significant threat to the residential real estate market.
INVENTORY IS TIGHT, SALES AND PRICE GROWTH ARE MODERATING
INVENTORY AND CLOSED SALES
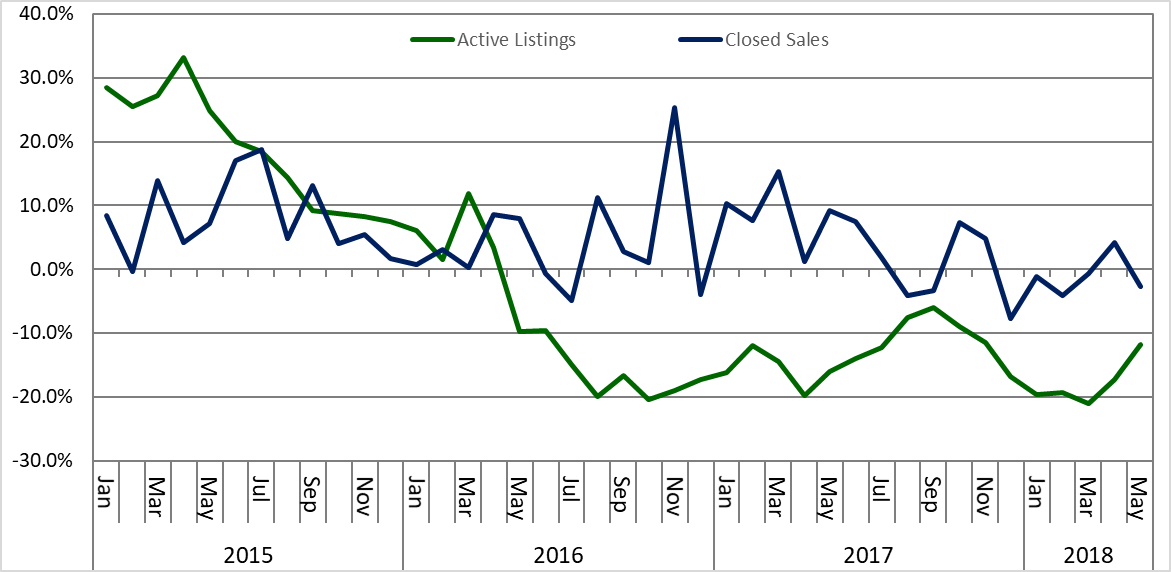
In the NVAR region, low inventory persists. January saw the lowest number of active listings in five years, and as of May 2018, inventory was down 11.9 percent from this point last year (Figure 5). In fact, inventory has declined from the previous year for 25 straight months beginning in May 2016. The expected spring inventory growth was down from record lows last year, as February and March inventory growth compared to 2017 remained at -19.4 percent and -21.1 percent, respectively. Active listings in April stood at 3,398 – 17.3 percent fewer than in April 2017.
Figure 5. Active Listings and Closed Sales, Percent Change from Prior Year, NVAR Region
Source: Bright MLS. Statistics calculated 6/5/2018
Low inventory of homes contributes to the increasingly downward trending closed-sales growth (Figure 5). Closed sales in the first three months of 2018 decreased from the year before and declined on average 2 percent – compared to growth of 11.1 percent over the same period last year. April saw a spike in closed sales numbers, but May sales reverted back to early 2017 growth rates – declining nearly 2.7 percent from the previous year. Existing home sales growth continues to outpace new listings, so expect inventory to remain tight.
In light of moderate economic and job growth, low inventory appears to be suppressing demand, and buyers find it increasingly difficult to find a suitable home. Sporadic, yet generally declining growth in sales numbers during the latter half of 2017 and beginning of 2018 demonstrate this trend.
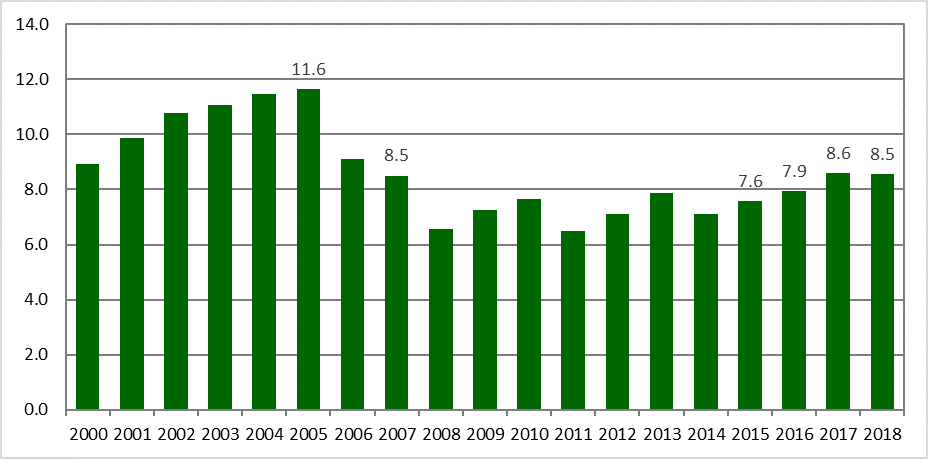
During the first five months of 2018, the total number of closed sales was 0.7 percent lower than during the same period in 2017 (Figure 6). Compared to 2017, condo and townhome sales increased over the first five months, rising 2.3 percent and 3.8 percent respectively. Single-family detached homes had 5.1 percent less sales. Alexandria (+6.3 percent) and Fairfax City (+7.7 percent) were the only NVAR jurisdictions that had more closed sales in the first five months of 2018 compared to the same period in 2017. Arlington (-3.1 percent) and Fairfax county (-1.1 percent) sales declined slightly from last year, while Falls Church (-32.2 percent) experienced significantly diminished sales numbers.
Figure 6. Closed Sales in the NVAR Region, January through May of Each Year
(in thousands)
Source: Bright MLS. Statistics calculated 6/5/2018
According to the National Association of Realtors®, for the fourth year in a row, difficulty finding the right property has surpassed the difficulty in obtaining mortgage financing as the most cited reason limiting potential clients. With the March and June 2018 interest rate hikes and others expected in 2018, home purchases may decline as financing becomes more expensive, resulting in fewer sales and fewer vacating households. As buyers become even more discouraged and closed sales growth moderates, inventory will continue its precipitous decline while regional job growth continues.
AVERAGE SALES PRICE
Tight inventory typically edges up housing prices, increasingly pushing homeownership out of reach for many new residents who are drawn by the region’s job growth. In this environment, renting becomes a more financially viable option. Average existing home sale prices for all regional jurisdictions and property types continue creeping upward. However, prices are not rising as fast as they did last year. According to the latest Standard & Poor’s (S&P) CoreLogic Case-Shiller Home Price Index, prices in the Washington, D.C. region rose 2.4 percent over the past year – the slowest growth rate among the nation’s 20 largest cities and much lower than the national increase of 6.3 percent.
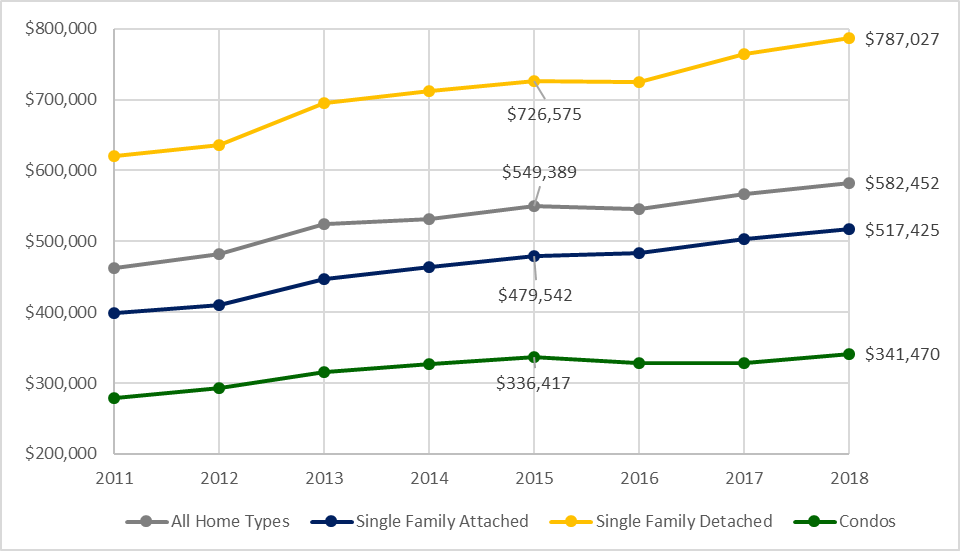
After sustained increases throughout 2017, the average NVAR region sales price rose only slightly in the first five months of 2018 (Figure 7). The year’s average sales price through May 2018 has increased 1.9 percent overall, compared to the same timeframe in 2017. Nevertheless, it has still reached the highest average sales price in recorded history over the first five months of the year, at $582,452. Property segment average price growth was led by condos, growing around 4 percent, while townhome and single-family detached home prices each rose 2.9 percent.
Figure 7. Average Sales Price for Property Types in the NVAR Region, January through May of Each Year
Source: Bright MLS. Statistics calculated 6/5/2018
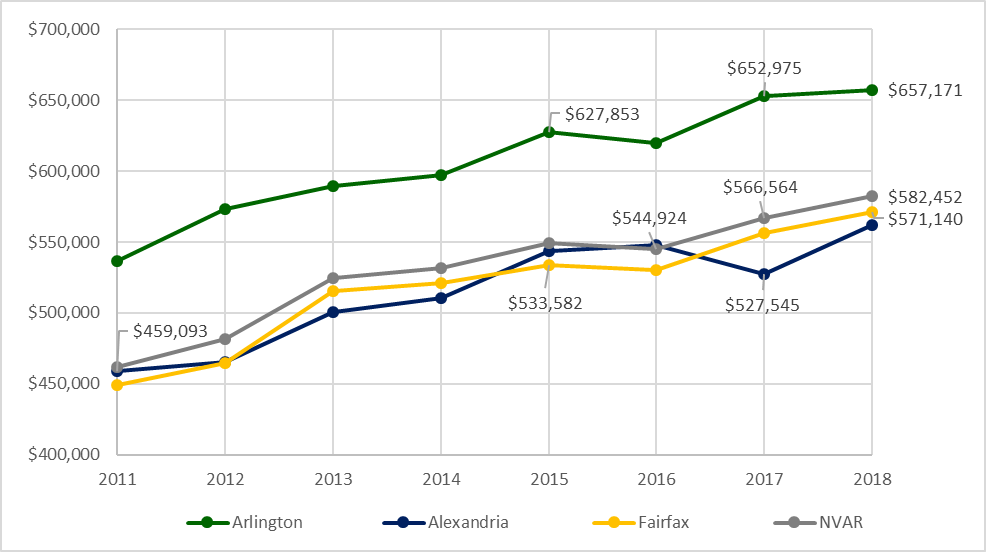
Among the NVAR jurisdictions, Arlington and Fairfax counties both remained relatively steady in average sales price. Arlington increased 0.6 percent, and Fairfax increased 2.7 percent during the first five months of 2018 compared to the same timeframe in 2017 (Figure 8). Falls Church prices also remained similar to last year with an average sales price decrease of 0.9 percent during this period. The two other regional jurisdictions that had larger growth in sales values were Fairfax City (+14.2 percent) and Alexandria (+6.5 percent).
Figure 8. Average Sales Price for NVAR Region Jurisdictions, January through May of Each Year
Source: Bright MLS. Statistics calculated 6/5/2018
Frustrated, yet savvy and informed buyers may be driving the unusual trend of record tight inventory along with moderating price increases. The NVAR market has favored sellers for several years, but buyers increasingly know what they want and understand its value. Therefore, aggressive pricing turns off buyers, and sellers are forced to negotiate, lest their properties sit on the market. Young buyers are waiting and renting longer in order to save for higher-priced homes.
Even if the region continues to add jobs, new workers might choose to remain renters if the cost of homeownership exceeds rental prices. According to Zillow, the number of apartment units in the D.C. region is up 19 percent from a year ago, which is the greatest increase in rental inventory among the country’s largest metro areas. Multi-family construction is also growing considerably, having risen 51 percent through April 2018 compared to the same period last year, and this in turn keeps rents low. Builders are banking on continued, strong demand for rental apartments, as homebuyers struggle to find affordable homes. Nevertheless, the economics of supply and demand will ultimately prevail. As the region’s millennial-heavy workforce creeps toward greater homeownership and as jobs in high paying sectors are continually added, demand for housing will persist. Combined with low inventory, there is little sign that home prices will decrease in the near future.
NEAR-TERM REGIONAL OUTLOOK
Consistent and slightly increased economic growth in the NVAR region will likely continue through the remainder of 2018. The new tax law temporarily incentivizing investment and the recently passed federal budget will likely drive regional job and wage growth, but this growth nevertheless relies heavily on federal spending. Continuous increases in high-wage jobs, particularly in the professional and business services sectors spurred by federal contracting, should signal an overall rise in average wages and thus housing demand.
However, housing supply continues to fall behind the level of demand. Inventory will be a persistent drag on sales for the remainder of the year. Expect lower sales growth than in previous years, and price increases to continue their upward rise. As higher-wage residents become accustomed to the new normal cost of a home purchase, lower-wage residents and workers will continue to rent or move elsewhere.