Category: Market Statistics

  • 2025 NVAR Regional Housing Market Forecast

    NVAR Predicts 2025 Northern Virginia Housing Market will Continue to Strengthen with Higher Levels of Market Activity and Growth in Housing Inventory 

    Each year, the Northern Virginia Association of Realtors® (NVAR), in conjunction with the Center for Regional Analysis at George Mason University (GMU-CRA), issues a consensus forecast for the NVAR region’s housing market. The Association convenes a panel of key experts from differing sectors of the real estate industry to review preliminary forecasts developed by GMU-CRA economists and offer their insights into current and near-future market conditions. The following represents the forecast team’s 2025 outlook. 

    The Northern Virginia housing market will continue to strengthen with moderate price increases and higher levels of market activity. Northern Virginia’s outlook is similar to the national 2025 housing forecast that predicts the worst of the housing inventory shortage is ending, mortgage rates are stabilizing, and job additions are continuing, according to the National Association of REALTORS®.  

    Other hopeful signs for the region’s economy and housing: 

    • Most markets will see more moderate price gains than in 2024, closer to 3%, with some higher levels of increases in tight markets — such as single-family homes inside the Beltway. 

    • Sales activity will increase with modest improvements in the region’s inventory. 

    • While still below pre-pandemic levels, most market segments in the region will see more homes for sale as move-up purchasers re-enter the market. 

    • Stability in mortgage rates will support higher levels of sales, as the market acclimates to higher, but more historically normal mortgage rates. 

    There are still some undetermined factors that may affect the region’s housing market. The promises made by the incoming administration during the presidential campaign may have an impact on the Northern Virginia housing market, which is a large submarket of Washington, D.C. The timing and magnitude of any government policy changes are unclear at this time. 

    NVAR’s 2025 Regional Housing Market Forecast includes Alexandria City and Arlington, Fairfax, Loudoun, Stafford, and Prince William Counties. Below is data for each jurisdiction. 

    Forecast by Jurisdiction 

    Fairfax County (View Charts) 

    • Single-family home prices are expected to rise 1.5% during 2025. 

    • Total unit sales for single-family units are forecasted to increase 5.7% in 2025 compared to 2024, a welcome change after several years of tightening inventories. 

    • The inventory of townhomes is forecasted to increase 6.0%, a slight opening of the supply of relatively affordable options for buyers. 

    • Strong demand for townhomes, due to their relative affordability compared to single-family homes in recent years, is set to continue into 2025 with unit sales rising 2.9% and pricing going up 3.9% compared to 2024. 

    • Condominium prices will be up 3.5% from 2024 to 2025, a slight slowing of price increases recorded in recent years. 

    • As demand for condos begins to wane somewhat, inventory is set to increase 3.6% from 2024 to 2025. 

    Arlington County (View Charts) 

    • Single-family inventory in Arlington is expected to increase 1.8% from 2024 to 2025. 

    • Total unit sales of single-family homes will decline 6.5% from 2024 to 2025, but in this small market that decline only represents a difference of 4 units per month. 

    • Despite the slight build-up in inventory and decline in sales, demand for Arlington single-family homes is set to push up prices 5.3% in 2025. Inside the Beltway will be competitive for buyers. 

    • Without many single-family units available, strong demand for Arlington townhomes will push up prices by 8.7% during 2025. 

    • While inventory is set to increase 4.3%, this represents an average increase of 1 unit being on the market at month’s end. 

    • Arlington condos recorded strong price increases in 2024, which creates market momentum, but affordability and the prospects for higher maintenance fees will soften price gains to 1.6% over 2025. 

    • As demand for Arlington condos softens slightly, unit sales will remain effectively flat and there will be a small uptick in inventory, averaging about 3.6% from 2024 to 2025. 

    Alexandria City (View Charts) 

    • Median prices of Alexandria single-family homes are expected to jump 9.9% in 2025, being influenced by return-to-office. 

    • Already low unit sales are set to contract further, with a total of just 285 sales in 2025, down 4.7% from 2024. 

    • Alexandria’s townhome market will see prices increasing 3.9% in 2025. 

    • Recent price increases for potential sellers coupled with buyers acclimating to higher rates are expected to result in the average year-over-year inventory increases of 5.2% from 2024 to 2025, which really suggests that some units will be on the market for a few extra days, on average. 

    • Along with other core condo markets, Alexandria condo prices will rise 1.5% in 2025, with slightly higher inventories and a flattening of unit sales. 

    Prince William County (View Charts) 

    • Prince William will remain a very attractive market for single-family homes with prices expected to rise by 3.5% for 2025, but still relatively affordable compared to core markets. 

    • The already tight inventory of for-sale single-family homes is forecasted to remain effectively unchanged and unit sales are forecasted to drop by 35 units (1%) for the year 2025. 

    • Townhomes in Prince William are forecasted to record a price increase of 4.0%, revealing the multi-year trend of families seeking this more affordable family-sized housing option is set to continue. The key market factor is being outside the core, but still a reasonable commute — reasonable by Northern Virginia standards. 

    • While year-over-year townhouse inventory is set to increase 5.0% on average, this comes after several years of inventory contraction. 

    • While Prince William’s condo market is not very large, prices are anticipated to increase 6.2%, revealing demand for relatively affordable homeownership opportunities. 

    • Both year-over-year unit sales and average year-over-year month-end inventory of condos are set to increase 6.0%, revealing that while the Prince William Condo market may not be large, it remains very active. 

    Loudoun County (View Charts) 

    • Robust price increases in Loudoun County are set to continue into 2025, with single-family homes forecasted to cost 5.5% more in 2025. 

    • The strong demand for Loudoun County single-family homes will push up unit sales by 4.0% from 2024 to 2025 while decreasing month-end inventory by 1.0% on average from 2024 to 2025. 

    • The strong demand for Loudoun County also appears in the forecasted prices for townhomes, which will rise 3.8% in 2025 to a notable median price of $710,936. 

    • Townhouse inventory is forecasted to drop 3%, while unit sales will increase a mere 1%. 

    • As with single-family and townhomes, condominium prices are forecasted to increase a robust 8.1% over 2025. 

    • The strong overall demand to live in Loudoun County will keep condo inventories nearly flat and unit sales of condos increasing 2.0%, which means about 20 more sales in 2025. 

    Stafford County (View Charts) 

    • Single-family homes in Stafford are set to increase 4.5% for the upcoming year, a modest deceleration from price gains seen in recent years. 

    • Activity in single-family sales is set to remain strong rising 2.2% to 1,495 units in 2025 supported by a 2.5% gain in average month-end inventories. 

    • Townhome price increases will remain strong, increasing 3.5% in 2025 as market activity increases (1.9% more units) on rising inventory (+3.7%). 

    • Finally, while condo prices in the County are set to increase 3.9%, the County’s condo market is nascent, with just 89 unit sales forecasted for 2025. 

    Throughout the year, NVAR releases monthly market statistics, delivering local market data for the cities and counties in the NVAR region. Please visit nvar.com/MarketStats for more information.  

  • Condo Supply in the Greater NVAR Region Sinks Following Brief Pandemic Supply Increase

    By Dr. Keith Waters and Dr. Terry Clower

    George Mason University, Center for Regional Analysis 

    As the last of the pandemic effects fade, it seems appropriate to check back in on the condominium, or condo, market in the Northern Virginia Association of Realtors® (NVAR) region, as this market was arguably the most dramatically impacted. In the immediate wake of the pandemic, active listings pulled back as sellers reassessed their plans and then increased dramatically at the end of 2020 and into 2021 as owners tried to offload properties that were seen as being more conducive to the spread of the coronavirus. Since this immediate reaction, however, the condo market in the NVAR region has not only survived but thrived. As the pandemic has normalized hybrid-remote work, NVAR Realtors® are serving an even larger geography, and thus we are including counties adjacent to NVAR proper jurisdictions.

    In the lead up to the pandemic, condo supply (active listings) in the Greater NVAR region was in the midst of a long-developing supply contraction that began in the summer of 2015. Total active listings in the greater NVAR region peaked at 2,188 in July 2015, before declining relentlessly for five consecutive years to a low of just 427 in December 2019. The COVID-19 pandemic sparked fears about being near other people, which resulted in the mass adoption of remote work. These factors resulted in both increased choice in where to live for buyers but also a reduced demand for dense condo living. For the condo market, the result was an increased number of active listings, which spiked to 1,397 by October 2020. However, after a year of limited alternate options and the most acute pandemic fears having faded, active supply quickly reverted to pre-pandemic trends, contracting sharply to just 533 by February 2022, eventually hitting a low of 489 in January 2024. This trend was recorded in all jurisdictions in the Greater NVAR region, varying only by the size of the condo market in each (Figure 1). While recent months have recorded some supply expansion in the NVAR region, it seems likely that if the Federal Reserve moves to lower the Federal Funds rate, supply may again contract as new buyers enter the market to take advantage of lower mortgage rates.

    Figure 1. Active Listings (Month-End) of Condos in the Greater NVAR Region

    Condo Supply in the Greater NVAR Region Sinks Following Brief Pandemic Supply Increase - Image

    Examining subregional variation of condo prices, Figure 2 displays the median closed price for condos sold in 2024 by zip code. Note that not all zip codes had closed sales. The two zip codes with the highest closed sales prices were Del Ray and Tysons, with median closed prices of over $590,000 each. Old Town Alexandria had the third highest median closed sales price at $575,000.  Other zip codes with high closed sales prices include Western Arlington near the East Falls Church Metro, Vienna, Rosslyn, and Southwest Ashburn. For buyers priced out of these areas, there tend to be adjacent zip codes that have notably lower median prices.

    Figure 2. Median Condo Prices in the Greater NVAR Region by Zip Code

    Condo Supply in the Greater NVAR Region Sinks Following Brief Pandemic Supply Increase - Image

    Examining jurisdictional level data from 2019 through the first half of 2024 reveals that the regions with the highest sales prices are not necessarily those that recorded the largest price increases in the wake of the pandemic. While Arlington has several of the most expensive condo markets in the NVAR region, the median condo price increased just 7.7% from 2019 to 2024, with nearly all the increase coming between 2023 and 2024. Meanwhile, the median price of sold condos in Manassas and Prince William County increased 57.1% and 53.3% respectively. Loudoun County is the exception, the county recorded strong price growth and is home to some of the most expensive condo submarkets.

    Figure 3. Jurisdiction Median Price Index

    Condo Supply in the Greater NVAR Region Sinks Following Brief Pandemic Supply Increase - Image

    A trend that has held up in the wake of the pandemic, including in the condominium market, is the apparent buyer preference for more space. Examining the median price index of condos in the Greater NVAR region by number of bedrooms (Figure 4), reveals that the strongest price growth has been among condos with two or three bedrooms. It is nearly certainly the case these have seen stronger price growth as buyers look to use additional bedrooms as home offices and flex space for home-school days. From 2019 to 2023, the median prices of two- and three-bedroom condos increased 33.0% and 37.0%, respectively. Meanwhile, the median prices of studio and one-bedroom apartments only increased 15.5% and 21.5%, respectively.

    Figure 4. Jurisdiction Median Price Index

    Condo Supply in the Greater NVAR Region Sinks Following Brief Pandemic Supply Increase - Image

    Overall, although the pandemic briefly triggered an increase in active condo listings in the Greater NVAR region, the longer-term trend of relentless supply declines resumed just two years later. Locations that have historically been the most desirable locations for condo owners, such as Alexandria, Arlington, and Tysons, have remained the most desirable. However, there have been strong price gains in new, more exurban markets (areas outside of the denser inner suburbs), such as Manassas and Prince William. Finally, the desire for more bedrooms, sparked largely by hybrid work appears here to stay, with larger condos having recorded the strongest price growth in the wake of the pandemic. Moving into the rest of 2024, it will be worth keeping an eye out on the number of active listings of condos. While there has been a slight increase in the middle of 2024, it will be interesting to see if the trend continues or if this is just a blip. 

  • Free and Clear Home Ownership in the Greater NVAR Region

    By Dr. Keith Waters and Dr. Terry Clower

    George Mason University, Center for Regional Analysis

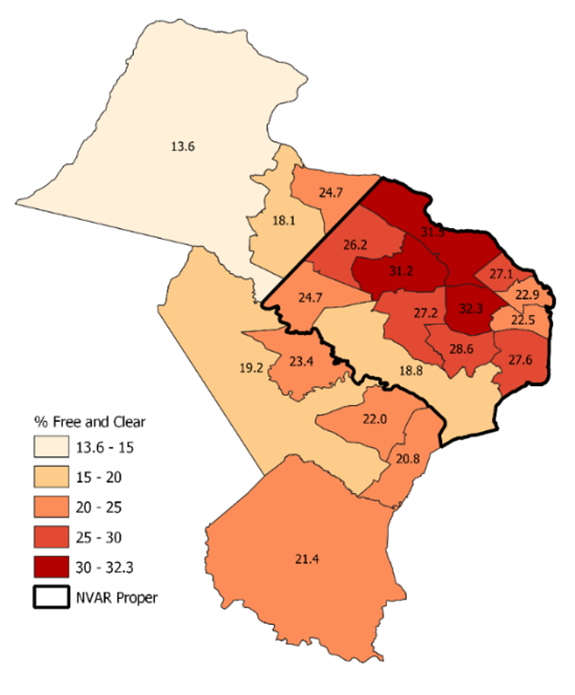
    In previous publications, we discussed continuing drops in housing inventory in the NVAR region. While much of the decline in inventory can plausibly be attributed to people staying in their houses (in love with their mortgage interest rate), some people are staying put because they own their homes free and clear. That is, they have no mortgage. This article examines free and clear home ownership in the NVAR region , including Fairfax and Arlington counties, the cities of Alexandria, Fairfax, and Falls Church and the towns of Vienna, Herndon, and Clifton. It also examines the Greater NVAR region, including neighboring Loudoun County, Prince William County, Manassas City, Manassas Park City, and Stafford County to offer insights on market directions over the next few years.

    Homes Owned Free and Clear

    In 2022, the NVAR region had an estimated 371,623 homeowner households, with 100,047 (26.9%) owning their homes free and clear. The remaining 271,576 (73.1%) owned their home with a mortgage. Free and clear ownership was more common in the core NVAR region than in farther out jurisdictions. Only 20.1% of homes in these surrounding counties are owned outright, which is likely attributable to the age of the housing stock. For more than a decade, the outer lying suburbs have seen most of the region’s new home building. Households without a mortgage are even less likely to sell than those with low mortgage rates, and while some circumstances can force people to sell, the financial advantages of staying in a home without a mortgage can be substantial, especially at today’s interest rates.

    Ownership NVAR Region Greater NVAR Region
    Households % of Owned Households % of Owned
    Owned with a Mortgage 271,576 73.1% 506,012 76.1%
    Owned Free and Clear 100,047 26.9% 158,935 23.9%
    Total 371,623 100.0% 664,947 100.0%
    Source: American Community Survey, 2022 1-year estimates.

    The share of households that own their home free and clear varies notably by home type. Of the 69,929 condo households, almost 30 percent own their home free and clear, the highest rate among all home types. In comparison, among the 166,850 households who own a townhome, just under 20 percent own their home free and clear. Detached single-family homeownership is in-between condos and townhomes with 24 percent of the 423,984 detached homes being owned outright. As residential prices continue to increase, condo inventory will likely remain tighter than townhome inventory, as condo owners who own their unit free and clear are likely to be reluctant to move while townhome owners are more likely to have a mortgage and may be more inclined to relocate, putting their unit on the market. A more positive spin is to consider that a condo-owner without a mortgage can have a large downpayment on a new home that will offset mortgage interest costs.

    Home Type Mortgage Free and Clear Total Owned % Owned Free and Clear
    Condo             49,053             20,876             69,929 29.9%
    Detached          321,995          101,989          423,984 24.1%
    Townhome          133,712             33,138          166,850 19.9%
    Source: American Community Survey, 2022 1-year estimates. Estimates do not sum to total due to N/A data.

    Free and Clear by NVAR Sub-Region

    Examining home ownership by householder age reveals the intuitive result that older homeowners are more likely to own their home free and clear. Among homeowners 70 years or older, 52.8 percent own their home free and clear, compared to just 9 percent of homeowners ages 30 to 39. Interestingly, the youngest group, those under 30 years old, are more likely to own their home free and clear than those in the 30-39 age group or the 40 to 49 age group. Some of this may be the result of housing mix, as it is likely that the youngest group is more likely to own a condo than a detached home. Overall, older householders are much more likely to own their home free and clear with 37.1percent of all free and clear homes in the Greater NVAR region owned by those 70 years and older.

    Householder Age Mortgage Free and Clear Total Owned % Owned Free and Clear Share of All Free and Clear
    Under 30 years             17,164                3,083             20,247 15.2% 2.0%
    30 to 39             95,253                9,443          104,696 9.0% 6.1%
    40 to 49          129,340             20,536          149,876 13.7% 13.2%
    50 to 59          132,174             28,916          161,090 18.0% 18.6%
    60 to 69             80,436             39,175          119,611 32.8% 25.1%
    70 years and over             51,645             57,782          109,427 52.8% 37.1%
    Total          488,848          155,852          644,700 24.2% 100.0%

    Free and Clear Home Ownership in the Greater NVAR Region - Image

    Conclusions

    While the rapid increase in mortgage rates following historically low rates likely has contributed to low active listings, there are some signs that potential homebuyers are becoming more acclimatized to a higher interest rate environment. While homeowners who own their home free and clear will remain less likely to move, active adults who are not carrying a mortgage for their condo, townhome, or smaller detached property may become a great source of “move-uppers” over the next few years. We can also remain hopeful that downsizing empty nesters will return to market active status. The housing market in the Greater NVAR region remains robust, we just need more inventory!

  • NVAR Region 2024 Residential Real Estate Market Forecast Mid-Year Update

    NVAR Region 2024 Residential Real Estate Market Forecast Mid-Year Update - Image

    July 2024

    The Northern Virginia Association of Realtors® (NVAR), in conjunction with the Center for Regional Analysis at George Mason University (GMU-CRA), issues a consensus forecast for the NVAR region’s housing market. The association convenes a panel of key experts from differing sectors of the real estate industry to review preliminary forecasts developed by GMU-CRA economists and offer their insights into current and near-future market conditions. The following represents the forecast team’s mid-year update to the 2024 outlook.

    While both the residential and commercial continue to stabilize, the region’s real estate market still has not reached a post-pandemic equilibrium. The inflation rate has continued to slow, with core inflation declining steadily since September 2022. Additionally, the national labor market has remained stronger than anticipated. While hopes of a soft-landing remain, there are continued signs of weakness:

    • While the unemployment rate remains low, it has been increasing since early 2023.
    • Temporary help employment, which declines during recessions, has been declining since March 2022.
    • Overall inflation has moderated to 3.0% in the June 2024 reading; however, household budgets are stretched due to cumulative price increases.
    • Households have spent down their excess savings accumulated during the pandemic.

    While the prospects of a soft landing remain, the rise in interest rates that began over 2 full years ago appears to only now be impacting national economic performance. While a national recession remains a possibility, actions taken by the Federal Reserve in the near term will greatly impact the trajectory of the national economy. Our forecast for the DC region is that job growth will stagnate this summer after three years of moderation. While we may see job losses in the second half of the year, losses are not anticipated to be large or last long enough to qualify as a regional recession.

    As has been the case for several years now, home values continue to appreciate in the face of higher mortgage rates due primarily to low inventory. The inventory of for-sale homes has continued to surprise to the downside, made only worse by homeowners holding onto their 3% mortgage rates. Uncertainty around the Federal election will further weaken the economic prospects of the region as businesses are likely to hold off on any major decisions until after November 5th, 2024.

    While the region’s economic outlook continues to be plagued by weakness and uncertainty, there are hopeful signs:

    • Housing demand continues to outpace supply, driving price stability.
    • Local jurisdictions are starting to take real action to increase the supply of for-sale homes at prices affordable to young professional families, a requirement for economic success, even if the supply hasn’t started to matriculate just yet.
    • Hybrid work has been fully embedded into work-life, resulting in a geographic expansion of the Northern Virginia labor/housing market.
    • Northern Virginia continues to attract regional workers.
    • The region’s spring housing market activity surprised to the upside.

    As Northern Virginia has continued to expand in the wake of the pandemic, it’s regional importance has only increased. What were once outer suburbs of DC have become more central neighborhoods for job centers in Arlington and Fairfax. This, along with hybrid work, has allowed workers to locate even farther from core jurisdictions (inside the beltway). As a result, more Northern Virginia Realtors® are expanding their business and transacting real estate in Loudoun, Prince William, and Stafford counties. We have followed suit and expanded the regional housing market forecast to include these jurisdictions.

    Forecast by Jurisdiction

    Fairfax County (view charts)

    The market for single family homes in the region’s largest jurisdiction has returned to growth with prices forecast to by up 8.1% from December 2023 to December of 2024. Inventory has rebounded marginally, with average month-end inventory forecast to increase 1.6% from 2023 to 2024, leading to an increase in total sales volume of 4.6% from 2023 to 2024.

    Relatively flat inventory for townhomes will weigh on total townhome sales in Fairfax County, as existing owners are likely to choose their 3% mortgages over more space. However, given that demand remains relatively strong, prices for townhomes are forecast to increase 3.9% from December 2023 to December 2024.

    Prices for Fairfax condominiums are forecast to grow more modestly than single family or townhomes, gaining 2.9% from December 2023 to December 2024. This trend is partially the result of relatively large increases in average month-end inventory, which is forecast to increase 10.0% from 2023 to 2024. Increased inventory will lift total sales volume 1.7% from 2023 to 2024, a welcome change after two years of slowing sales volume.

    Arlington County (view charts)

    Overall affordability and mortgage rates continue to constrain price gains of single-family homes in Arlington after robust increases the past several years. Median prices for Arlington single family homes will increase 0.7% from December 2023 to December 2024. After two years of contracting inventory, average month-end inventory is forecast to increase 2.1% from 2023 to 2024, which will lift total sales volume 5.5% over the same period.

    Strong demand for Arlington will push prices for Arlington townhomes up 13.3% from December 2023 to December 2024. Furthermore, a 2.9% increase in average month-end inventory from 2023 to 2024 will help lift sales volume 9.4% over the same period.

    While average month-end inventory for condos will be down 1.6% in 2024, demand will continue to support sales volume and price growth. Total sales volume will increase 5.1% from 2023 to 2024, while the median sales price of condos is forecast to increase 4.2% from December 2023 to December 2024.

    Alexandria City (view charts)

    Alexandria is the smallest market in Northern Virginia. There are relatively few sales of single-family units each month, resulting in sizable price swings depending on the characteristics of monthly sales (size, location, etc.). While the price of single-family homes is forecast to decline 5.6% from December 2023 to December 2024, the more notable trend is continued moderation of monthly price swings. Average month-end inventory will increase just 2.7% from 2023 to 2024, and total sales will follow suit, increasing 2.5% over the same period.

    Alexandria townhome inventories are forecast to be down 7.6% in 2024 with sales activity remaining relatively flat, growing just 2.1% on average for the year. Prices will decline moderately, falling 0.9% from December 2023 to December 2024.

    Demand for Alexandria condos has cooled, with average month-end inventory now forecast to increase 1.3% from 2023 to 2024, as sales are forecast to decline 4.6%. Despite the building inventory, the median price of sold condos in Alexandria will grow a modest 4.5% from December 2023 to December 2024.

    Prince William County (view charts)

    Prince William County continues to be an attractive option for families seeking comparatively affordable single family homes that simply are not available in Arlington, Alexandria, and increasingly in Fairfax. Unfortunately, average month-end inventory is forecast to decline 10.2% from 2023 to 2024. Inventory constraints will weigh on total sales, which are forecast to increase just 2.4% from 2023 to 2024. While supply continues to be constrained, demand remains, and prices are forecast to increase 8.9% from December 2023 to December 2024

    The median sales price of townhomes in Prince William County is forecast to increase 7.5% from December 2023 to December 204, further reflecting the multi-year trend of families seeking this more affordable, but family-sized housing options. While sales volume growth of townhomes is anticipated to be in-line with single family, increasing 2.2% from 2023 to 2024, average month-end  townhome inventory is forecast to increase 3.4%, indicating that days on market may start to increase modestly.

    Although the condominium market in Prince William County is small, it is forecast to be strong for the remainder of 2024. The median sales price of condos in Prince William is forecast to increase 32.0% from December 2023 to December 2024. Furthermore, total sales are forecast to increase 3.1% from 2023 to 2024 while the average month-end inventory is expected to decrease 18.2%.

    Loudoun County (view charts)

    After a year of slow price appreciation in 2022, prices for single family homes in Loudoun County  returned to strong price appreciation, which is forecast to continue with the median price of sold single family homes in Loudoun County increasing 5.4% from December 2023 to December 2024. The strong demand will result in average month-end inventory forecast decline 5.0% from 2023 to 2024 while the number of sales will increase 6.2%.

    Similarly, townhome prices are forecast to increase 7.0% from December 2023 to December 2024, and total sales are forecast to increase 2.2% from 2023 to 2024. However, inventory is anticipated to build, with the average month-end inventory growing 9.6% from 2023 to 2024.

    Average month-end inventory of condominiums for sale in Loudoun County is a bright spot for buyers, as it is forecast to increase 19.6% from 2023 to 2024. The building inventory will prop up sales volume, forecast to increase 5.8% from 2023 to 2024, and keep price appreciation low, with the median sales price of sold units to increase just 0.3% from December 2023 to December 2024.

    Stafford County (view charts)

    Prior to the onset of the pandemic, Stafford County began to record a huge contraction in month-end inventory of single-family homes. The constrained inventory has remained low in the wake of the pandemic and is set to decline only marginally, with the average month-end inventory forecast to decline just 3.4% from 2023 to 2024. Low inventory will be a headwind for sales, which are forecast to decline 2.4% from 2023 to 2024. Given that demand remains, prices are set to increase 2.4% from December 2023 to December 2024.

    The average month-end inventory of townhomes, while representing a small market, is forecast to decline 22.8% from 2023 to 2024, as buyers continue to look for affordable, family-sized, housing. As with single family homes in Stafford, the tightening market will impact total sales, which are forecast to decline 0.3% from 2023 to 2024. While there may be less to buy and fewer sales, demand remains and those looking to buyer are forecast to push up the median price of sold townhomes 3.8% from December 2023 to December 2024.

    Although the condo market in Stafford is among the smallest markets in the Greater Northern Virginia region, average month-end inventory is set to increase 45.1% from 2023 to 2024. This is forecast to result in a 26.4% increase in total condo sales in the county all while the median price of sold condos increases 13.1% from December 2023 to December 2024

    Learn more at cra.gmu.edu and NVAR.com/stats.


×

Member Login

Lookup NRDSID Forgot Password?