Keith Waters, PhD
Assistant Director
George Mason University, Center for Regional Analysis
Introduction
Recent data revealed the extent of federal job losses in the Greater Washington and Northern Virginia Region. Northern Virginia alone lost 12,200 federal jobs, down from 95,000 in November 2024 to 82,800 in November 2025, a decline of 12.8%. This has resulted in speculation that inventory may rise as some of these workers decide to leave the area. This analysis examines inventory changes in the NVAR region.
Inventory in the NVAR Region
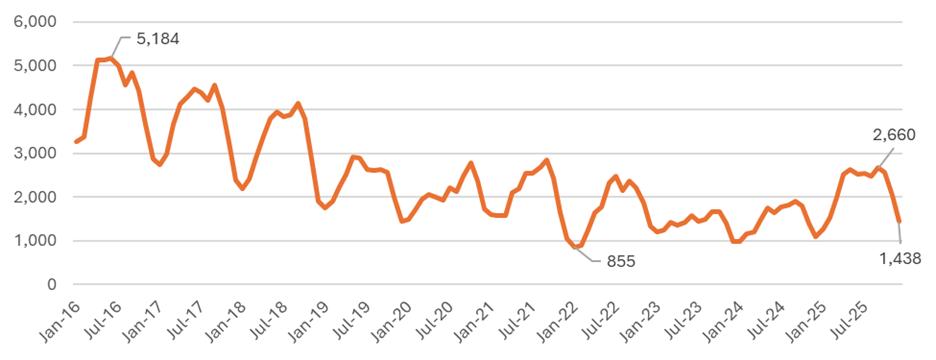
As the region’s economy has slowed, the housing market has loosened. In 2025, the average month-over-year change in inventory (e.g., January 2024 to January 2025 percent change) was 44.6%. While this may be large in percentage terms, when considered as the number of units over the past ten years, the change is currently unalarming (Figure 1). The number of active listings in the NVAR region has declined from a ten-year high of 5,184 in June of 2016 to a low of just 855 units in January of 2022. In 2025, the number of active listings peaked at 2,660 in September and ended the year at 1,438 in December. Looking back, the last time the number of active listings in December was at roughly this level was in 2019, when it was 1,446. In level terms, the rise in inventory is far below the number of federal job losses.
Figure 1. Active Listings in the NVAR Region: January 2016 to December 2025.
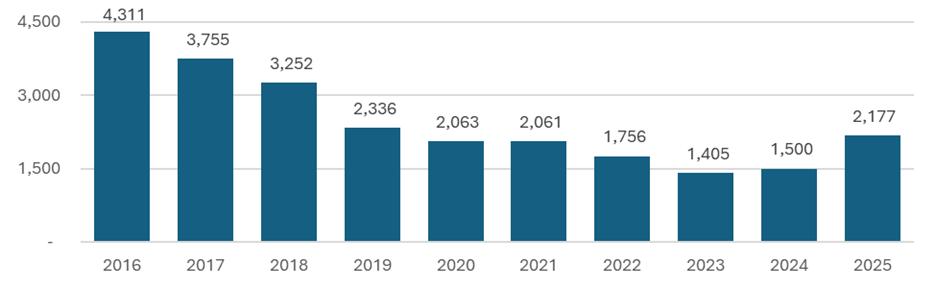
To see the increase in active listings more clearly, see Figure 2. In 2016, the average number of active listings at month-end was 4,311. The average number of listings declined to just 1,405 in 2023, then rose modestly to 1,500 in 2024 and somewhat more rapidly to 2,177 in 2025. The average number of month-end listings in 2025 was roughly comparable to the number in 2019. Again the rise in inventory is more modest than federal job losses might suggest.
Figure 2. Annual Average Month-End Active Listings in the NVAR Region: 2016 to 2025.
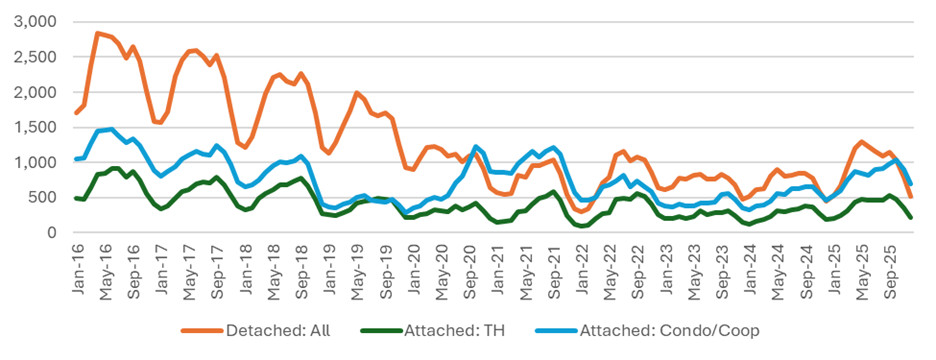
While the number of active listings in 2025 was generally comparable to 2019, there has been a distinct shift in home type. In 2019, active detached home listings ranged from 933 to 1,993, while active condo listings ranged from 292 to 529, well below detached home numbers. By 2025, however, the number of active detached home listings was roughly equal to the number of condos. By the end of the 2025, the number of active condo listings had surpassed the number of active detached listings: in December 2025, there were 693 active condo listings compared to just 522 active detached home listings.
Figure 3. Active Listing in NVAR by Home Type
On a month-over-year basis, the increase in condo inventory is evident. The month-over-year percent change in active inventory of condos was higher than detached homes every month in 2025, except for June, when detached homes rose marginally faster than condos (just 0.3 percentage points faster). For example, condo inventory rose 50% from December 2024 to December 2025 while detached inventory increased just 17%. While inventory has been rising among all home types, it has clearly been led by condo inventory.
Figure 4. Active Listing in NVAR by Home Type: Month-Over-Year % Change
Examining the share of active listings clearly reveals the shift towards more active condo listings. In 2019, condos accounted for roughly 18% of month-end active listings throughout the year, and detached homes accounted for 66%. In 2025, condos accounted for 38% of month-end active listings, while detached homes accounted for just 44%. This suggests that much of the softening in the housing market generally stems from the condo market, as the detached home market remains relatively stable.
Figure 5. Share of Active Listing in NVAR by Home Type
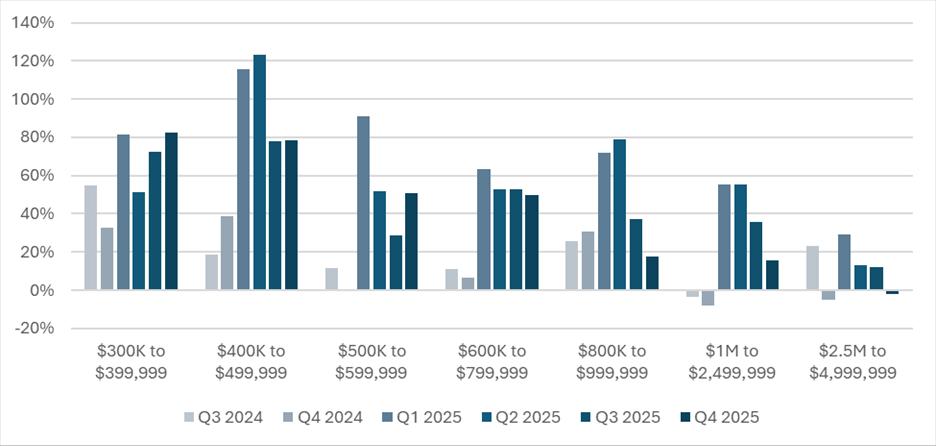
Given that the increase in active listings has been driven disproportionately by condos, the increase in active listings should then tilt towards an increase in lower-priced listings, which is indeed the case (Figure 6). From the third quarter of 2024 to the fourth quarter of 2025, active inventory of homes of all types with lower listing prices increased at a faster rate than more expensive homes. For example, inventory of homes with a list price of $300,000 to $399,999 increased 82.5% from the fourth quarter of 2024 to the fourth quarter of 2025. By contrast, the number of active home listings priced between $1M and $2.5 M increased just 15.5% from the fourth quarter of 2024 to the fourth quarter of 2025, and the number of active listings priced between $2.5M and $5M declined over the same period. The overall trend is that active listings of lower-priced homes have increased faster, likely reflecting the rise of active condo listings.
Figure 6. Active Listing in NVAR by List Price: Month-Over-Year % Change
Conclusion
Although the number of active listings in the NVAR region increased over the course of 2025, the increase was not nearly as severe as the recent employment losses stemming from the federal government. Furthermore, the rise in active listings also represents a shift in the market, as the share of condo listings has increased relatively to single family homes. The rise in active listings of condos is likely behind the rise in active inventory being disproportionally less expensive, as more expensive listings increased at a slower rate than less expensive listings. Overall, the NVAR housing market remained more robust in 2025 than federal job losses would suggest, particularly for single family detached homes.