By Dr. Keith Waters and Dr. Terry Clower
George Mason University, Center for Regional Analysis
In previous publications, we discussed continuing drops in housing inventory in the NVAR region. While much of the decline in inventory can plausibly be attributed to people staying in their houses (in love with their mortgage interest rate), some people are staying put because they own their homes free and clear. That is, they have no mortgage. This article examines free and clear home ownership in the NVAR region , including Fairfax and Arlington counties, the cities of Alexandria, Fairfax, and Falls Church and the towns of Vienna, Herndon, and Clifton. It also examines the Greater NVAR region, including neighboring Loudoun County, Prince William County, Manassas City, Manassas Park City, and Stafford County to offer insights on market directions over the next few years.
Homes Owned Free and Clear
In 2022, the NVAR region had an estimated 371,623 homeowner households, with 100,047 (26.9%) owning their homes free and clear. The remaining 271,576 (73.1%) owned their home with a mortgage. Free and clear ownership was more common in the core NVAR region than in farther out jurisdictions. Only 20.1% of homes in these surrounding counties are owned outright, which is likely attributable to the age of the housing stock. For more than a decade, the outer lying suburbs have seen most of the region’s new home building. Households without a mortgage are even less likely to sell than those with low mortgage rates, and while some circumstances can force people to sell, the financial advantages of staying in a home without a mortgage can be substantial, especially at today’s interest rates.
| Ownership | NVAR Region | Greater NVAR Region | ||
|---|---|---|---|---|
| Households | % of Owned | Households | % of Owned | |
| Owned with a Mortgage | 271,576 | 73.1% | 506,012 | 76.1% |
| Owned Free and Clear | 100,047 | 26.9% | 158,935 | 23.9% |
| Total | 371,623 | 100.0% | 664,947 | 100.0% |
| Source: American Community Survey, 2022 1-year estimates. | ||||
The share of households that own their home free and clear varies notably by home type. Of the 69,929 condo households, almost 30 percent own their home free and clear, the highest rate among all home types. In comparison, among the 166,850 households who own a townhome, just under 20 percent own their home free and clear. Detached single-family homeownership is in-between condos and townhomes with 24 percent of the 423,984 detached homes being owned outright. As residential prices continue to increase, condo inventory will likely remain tighter than townhome inventory, as condo owners who own their unit free and clear are likely to be reluctant to move while townhome owners are more likely to have a mortgage and may be more inclined to relocate, putting their unit on the market. A more positive spin is to consider that a condo-owner without a mortgage can have a large downpayment on a new home that will offset mortgage interest costs.
| Home Type | Mortgage | Free and Clear | Total Owned | % Owned Free and Clear |
|---|---|---|---|---|
| Condo | 49,053 | 20,876 | 69,929 | 29.9% |
| Detached | 321,995 | 101,989 | 423,984 | 24.1% |
| Townhome | 133,712 | 33,138 | 166,850 | 19.9% |
| Source: American Community Survey, 2022 1-year estimates. Estimates do not sum to total due to N/A data. | ||||
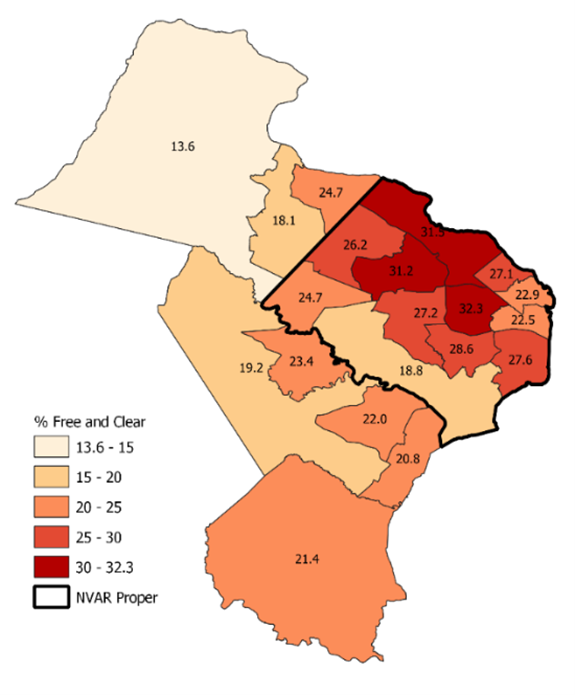
Free and Clear by NVAR Sub-Region
Examining home ownership by householder age reveals the intuitive result that older homeowners are more likely to own their home free and clear. Among homeowners 70 years or older, 52.8 percent own their home free and clear, compared to just 9 percent of homeowners ages 30 to 39. Interestingly, the youngest group, those under 30 years old, are more likely to own their home free and clear than those in the 30-39 age group or the 40 to 49 age group. Some of this may be the result of housing mix, as it is likely that the youngest group is more likely to own a condo than a detached home. Overall, older householders are much more likely to own their home free and clear with 37.1percent of all free and clear homes in the Greater NVAR region owned by those 70 years and older.
| Householder Age | Mortgage | Free and Clear | Total Owned | % Owned Free and Clear | Share of All Free and Clear |
|---|---|---|---|---|---|
| Under 30 years | 17,164 | 3,083 | 20,247 | 15.2% | 2.0% |
| 30 to 39 | 95,253 | 9,443 | 104,696 | 9.0% | 6.1% |
| 40 to 49 | 129,340 | 20,536 | 149,876 | 13.7% | 13.2% |
| 50 to 59 | 132,174 | 28,916 | 161,090 | 18.0% | 18.6% |
| 60 to 69 | 80,436 | 39,175 | 119,611 | 32.8% | 25.1% |
| 70 years and over | 51,645 | 57,782 | 109,427 | 52.8% | 37.1% |
| Total | 488,848 | 155,852 | 644,700 | 24.2% | 100.0% |
Conclusions
While the rapid increase in mortgage rates following historically low rates likely has contributed to low active listings, there are some signs that potential homebuyers are becoming more acclimatized to a higher interest rate environment. While homeowners who own their home free and clear will remain less likely to move, active adults who are not carrying a mortgage for their condo, townhome, or smaller detached property may become a great source of “move-uppers” over the next few years. We can also remain hopeful that downsizing empty nesters will return to market active status. The housing market in the Greater NVAR region remains robust, we just need more inventory!