By Dr. Terry Clower & Dr. Keith Waters
A longstanding trend in the Northern Virginia housing market has been the relentless decline in housing inventory. As the broader Washington, DC area’s economy has continued to grow in concert with the declining inventory, housing prices have surged. The soaring regional price for housing is the primary reason driving some residents to want to leave the region, as reported by the Washington Post. Higher rents, which rose 14.8% based on data from Delta Associates during 2021, are proving especially problematic for lower income workers and are making it harder for would-be homeowners to save for a down payment. As millennial households in our region started forming families, they were helped by low mortgage rates, while still challenged by student debt and rising housing costs. Now, as mortgage rates are increasing, this economically critical cohort of young, professional workers are finding homeownership in the Washington, DC region increasingly out of reach, which has long-term implications for the competitiveness and sustainability of the region’s economy. This article takes a deep dive into housing inventory data to examine the state of the market for more affordable for-sale housing and its implications for workforce retention and attraction.
Workforce Housing Supply – Active Listings by Type and Price Category
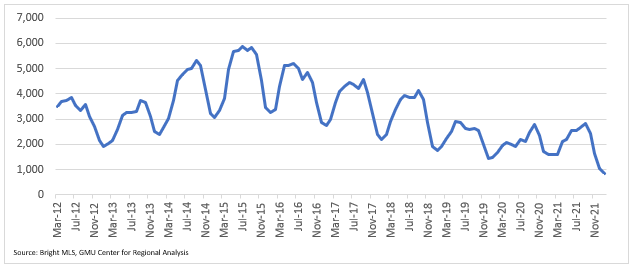
The supply of for-sale housing in the NVAR region has declined steadily for 6 years. Before the current cycle of housing supply shortage, the number of active listings increased from a low of 1,909 units in January of 2012 to a high of 5,864 units in July of 2015. Following this peak, the number of active housing units for sale at the end of the month declined year-over-year every single month from May 2016 through September 2020, when there were just 2,469 active listings at month-end. From October 2020 through September 2021, the number of active listings remained relatively flat, which is a testament to housing market resiliency and the ability of professionals across all elements of the residential real estate market to adapt rapidly and efficiently to pandemic-driven market conditions. However, following this momentary pause, housing supply in the NVAR region tightened further still. In September 2021, there were 2,836 active listings in the NVAR region. In January of 2022, there were just 855 active listings in the entire NVAR region, a 46% decline from the same month the year prior. Some of this decline is likely due to a market in January 2021 that exhibited little of the region’s normal seasonal listing activity.
Figure 1. Total Active Listings in the NVAR Region

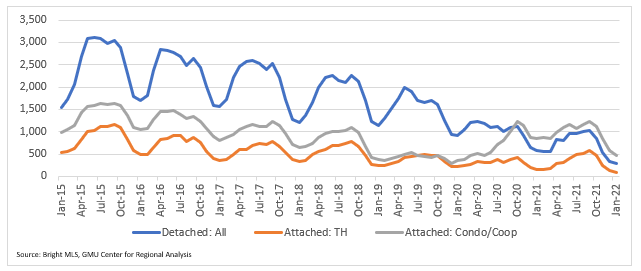
The decline in active listings has varied by housing type. Focusing on the period following the previous peak, active listings of all three housing types declined year-over-year nearly unabated from January 2016 through January 2020. The only year-over-year increase among any type over this period was a 3% year-over-year increase of active listings of Townhomes in August 2018. Although the total number of active listings continued to decline through the early months of the pandemic, active listings of condos immediately rose year-over-year in February 2020, while the number of active listings of townhomes and detached single-family homes continued to tighten. In January of 2020, there were just 348 active listings of condos in the NVAR region; this increased over the following months to 1,224 in October of 2020. While there was a seasonal decline over the following year, the number of active listings of condos remained relatively stable, with 1,221 active listings of condo units in September 2021. However, following this relatively stable period, the number of active listings of condos in the NVAR region plummeted to just 467 in January 2022. Thus, the relative stability of the overall supply of for-sale homes in the NVAR region was the result of active listings of condo units. As condos contracted, the entire housing supply contracted.
Figure 2. Active Listings in the NVAR Region by Housing Type

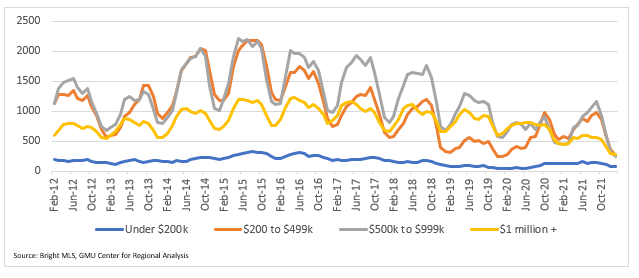
Examining the issue of workforce housing more directly, the supply of less expensive homes has become nearly non-existent. The least expensive active listings, those less than $200,000, have long been rare in the NVAR region. From February 2012 through December 2018, there were an average of 196 active listings in that price range in the NVAR region, with a period of slightly greater supply from January 2015 through December 2017. In January 2019, the supply of the most affordable active listings began to decline, contracting until only 34 active listings under $200,000 were available at the end of the month in December 2019. While inventory increased to the low 100’s in 2021, there were only 68 active listings in the NVAR region listed at under $200,000 in late February 2022.
However, even moderately priced homes (for the DC area) have also been in short supply. Active listings of the next most affordable category, units priced from $200,000 to $499,999, recorded a greater contraction from January 2015 through January 2020. In the first few months of 2015, there were around 1,200 active listings of homes priced between $200,000 and $499,999, and homes priced between $500,000 and $999,999. While inventory of housing units in both categories contracted over the next five years, the more modestly priced category had only 247 units for sale in January 2020, while there were 566 units priced from $500,000 to $999,999 the same month. After a period of increased inventory however, both categories have recorded dramatic declines in inventory. In January 2022, there were only 261 active listings between $200,000 and $499,999 in the NVAR region and only 248 active listings of units between $500,000 to $999,999. Of the 855 total active listings at the end of January 2022, there were 248, or 32.5%, listed at $1 million or more.
Figure 3. Active Listings in the NVAR Region by Listing Price

Examining the more modestly priced active listings reveals the intuitive fact that these tend to be either townhouses or condo units. There were only 10 detached homes for sale listed at under $500,000 at the end of January 2022. In fact, there were only 23 townhomes listed below $500,000 during the same period. Of the 329 active listings in the NVAR region that were below $500,000, condo units accounted for 296, or 90% of them. The distribution by unit type is much more balanced in the $500,000 to $999,999 category but is still predominately condos and townhomes. Of the 299 active listings of detached homes in the NVAR region at the end of January 2022, there were 213, or 71%, listed at $1 million or more.
Figure 4. Active Listings in the NVAR Region by Housing type and Listing Price (Jan. 2022)
|
Detached
|
Attached/TH
|
Condo
|
Total
|
|
Under $200k
|
5
|
0
|
63
|
68
|
|
$200k to $499k
|
5
|
23
|
233
|
261
|
|
$500 to $999k
|
76
|
48
|
124
|
248
|
|
$1 million or more
|
213
|
18
|
47
|
278
|
|
Total
|
299
|
89
|
467
|
855
|
|
Source: Bright MLS, GMU Center for Regional Analysis
|
Conclusion
As housing inventory has continued to contract and prices surged, the issue of workforce housing is becoming more pressing. While total inventory has been declining in the NVAR region, affordable inventory has contracted even more dramatically. Further, while condo inventory increased following the onset of the pandemic as some became concerned about close-quarters living or sought larger dwellings to accommodate work-from-home, the market supply of for-sale condos has recently declined. Examining housing inventory by type and list price reveals most clearly that the most affordable inventory is almost entirely comprised of condo units. Residents looking for detached single-family homes will find that 90% of active listings are listed at over $1 million. Moving forward, the continued price growth may impact the region’s economic competitiveness as it prices workforce out of housing options. Increasingly, regional employers are meeting labor demand by hiring remote workers, who have no intention of moving to this region. There are many questions about how remote work will play out in labor markets over the next several years, but one thing is apparent—if workforce housing options don’t meet the needs and affordability characteristics of young workers, this region’s ability to economically perform to potential will be limited.
Dr. Keith Waters is a research associate for the George Mason University Center for Regional Analysis.
Dr. Terry Clower is the director of the George Mason University Center for Regional Analysis.